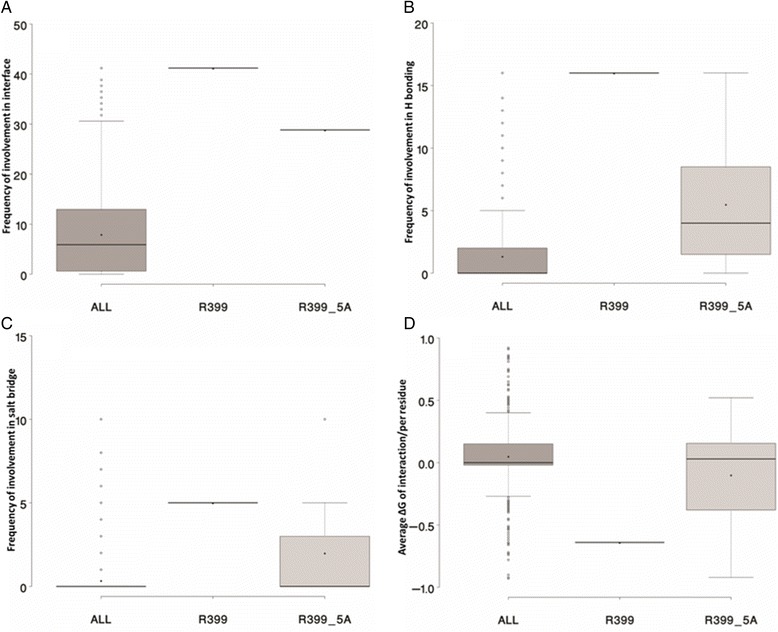
Fig. 7.

Panel a provides the distribution of occurrence frequencies of all residues (ALL), Arginine 399 (R399) and the residues within 5 Å distance of R399 (R399_5A) of PKM2 protein. Panel b, c, and d provide similar distribution of hydrogen bonding, salt bridge, and average ∆G of interaction, respectively
