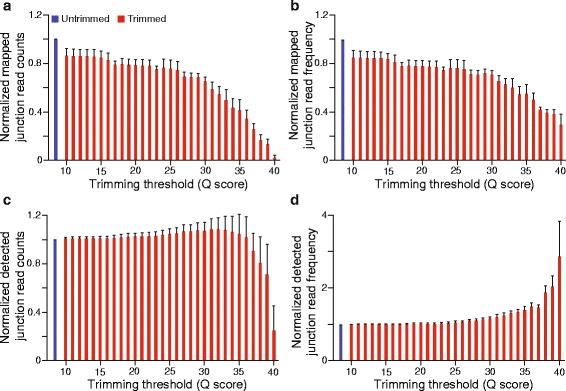
Fig. 3.

Influence of trimming on junction alignment and detection. a The average number of reads aligned to junctions per sample at a range of SolexaQA quality scores. b The average frequency of reads aligned to junctions (number of reads aligned to junctions per total reads aligned). c The average number of junctions detected per sample. d The average frequency of junction detection (number of junctions detected per total reads mapped). For all panels, data were normalized to the untrimmed value on a per sample basis. Error bars represent standard deviations
