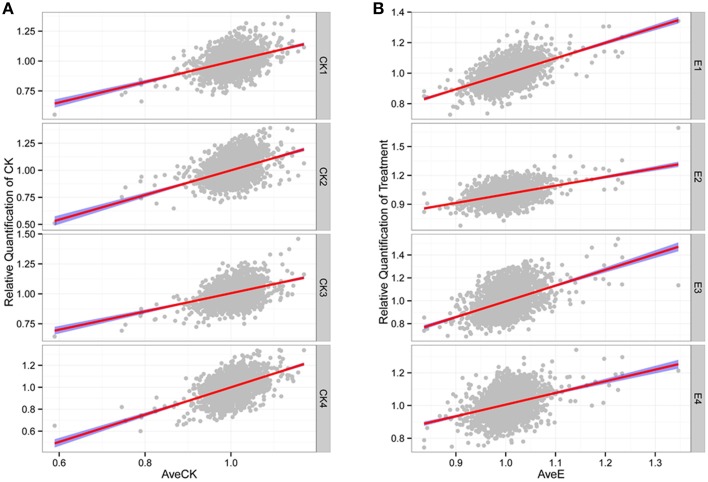
Figure 1.
High correlation among different replicates. (A) Relative quantification of CK. (B) Relative quantification of treatment. The “AveCK” represents the average quantification among control samples, and the “AveE” means the average quantification among experimental samples, and the “CK1~4” and “E1~4” are the corresponding different individuals.

