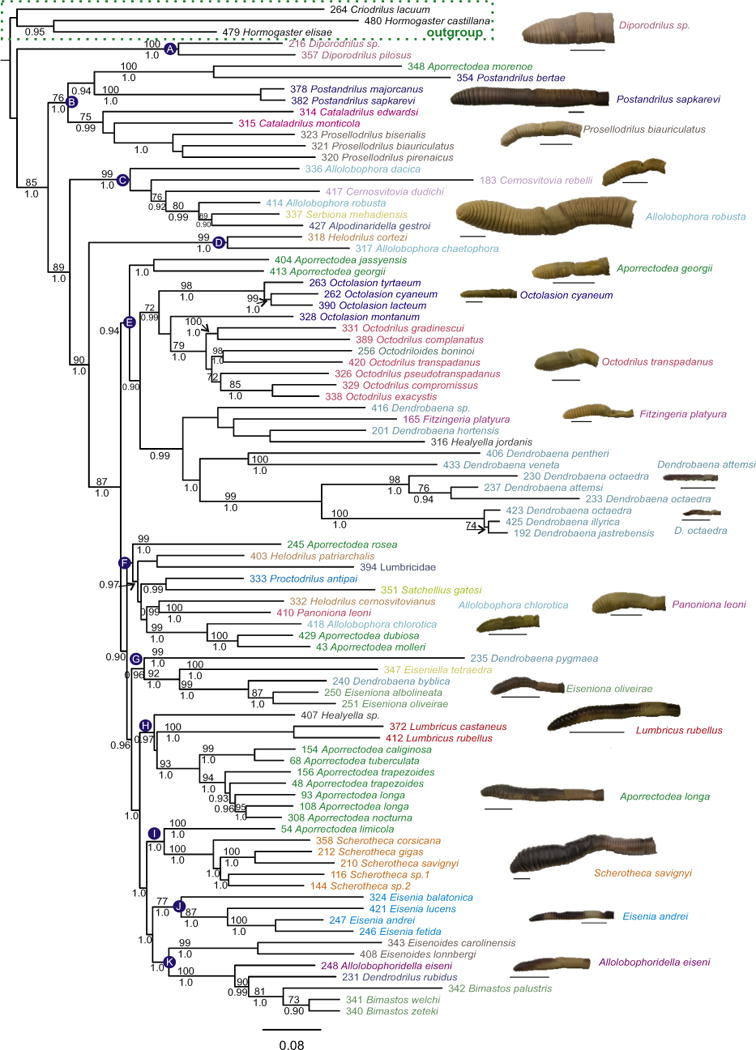
Fig. 1.

Lumbricidae maximum likelihood molecular tree. Bootstrap proportions (if ≥70%) and Bayesian posterior probabilities (if ≥95%) are shown above and below the branches, respectively. Selected taxa were pruned to facilitate visualisation of lumbricid relationships. The full tree is shown in Fig. S3 in supplementary material. Letters A–K refer to clades discussed in the text. Specimen photographs for selected lineages are also shown (bar = 1 cm). Code numbers are provided for each specimen.
