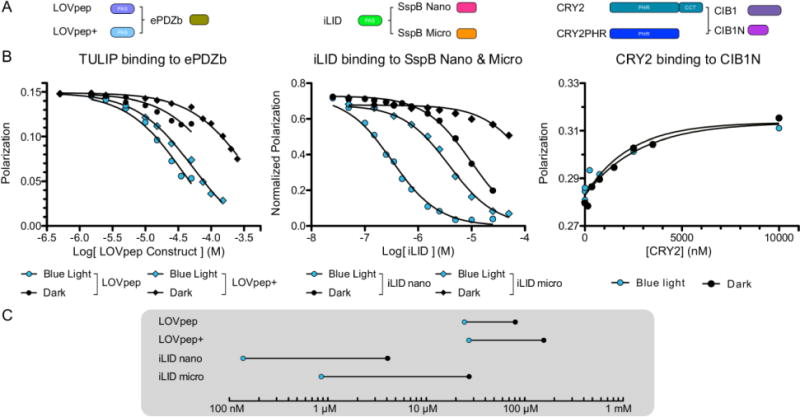
FIGURE 1. Binding affinities of lit and dark states highlight difference in photoswitch dynamic range.

Fluorescence polarization binding plots for A) LOVpep constructs and ePDZb (left) iLID nano and micro (middle) and CRY2 and CIB1N (right). B) Fluorescence polarization of each complex was measured under blue light (blue) or darkness (black) to determine binding affinity. C) Affinity values from binding data plotted on a Dynagram highlight the dynamic range of each tool.
