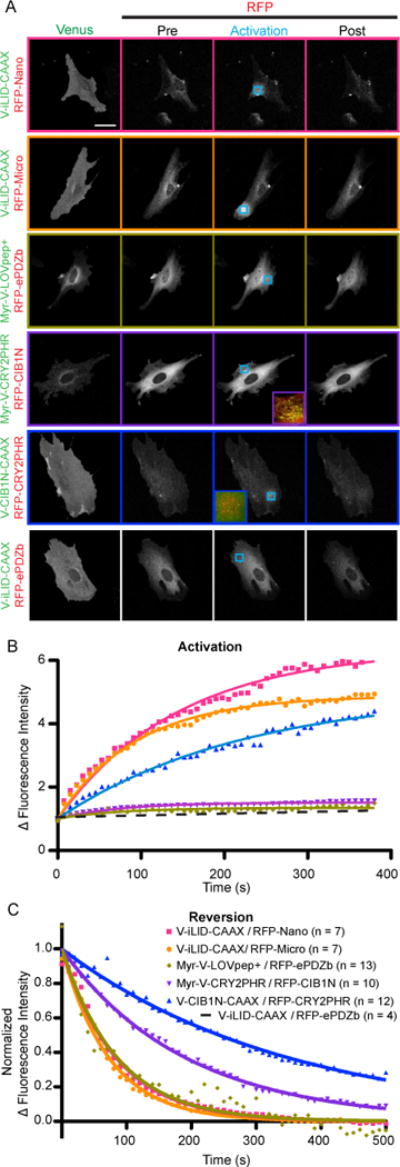
FIGURE 4. Targeted localization to the plasma membrane shows differences in switch dynamic range and kinetics.

A) Representative images of the data analyzed in B and C. Cells transfected with each membrane bound switch pair were visualized and activated by confocal microscopy. Venus labeled constructs are bound to the plasma membrane while tgRFPt labeled constructs are cytoplasmic. The activated ROI is identified by the blue arrow. The activation and post activation images represent the final image of the specified time frame. (Bar = 50 μm) B) A ratio of tgRFPt fluorescence intensity inside the activated ROI to outside the activated ROI during the period of activation as shown in A. C) A normalized ratio of tgRFPt fluorescence intensity inside the activated ROI to outside the activated ROI during the period of activation as shown in A.
