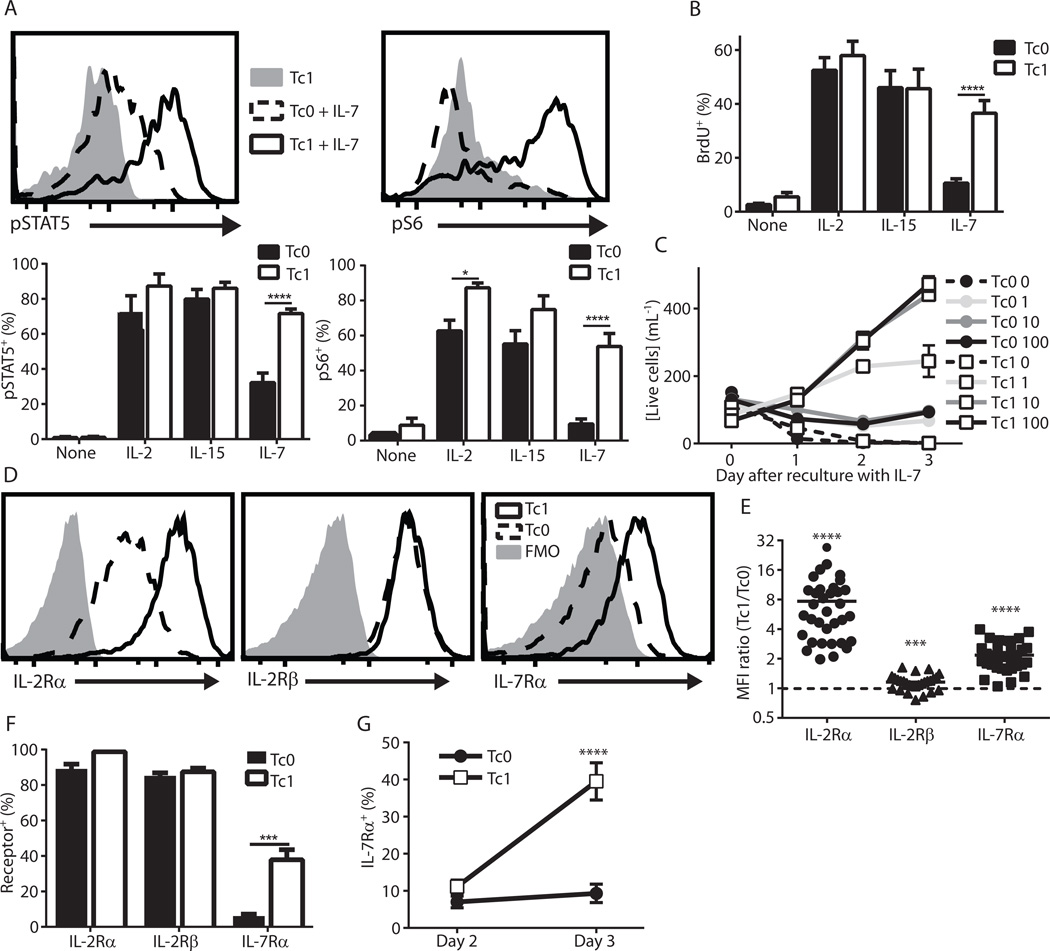
Figure 3. IL-12 conditioning during CD8+ T cell activation leads to elevated IL-7 responsiveness and IL-7Rα expression in vitro.
(A–C) Pmel-1 T cells were activated for 3 days with (Tc1) or without (Tc0) IL-12, washed and replated in the indicated cytokines (A, top). Representative histograms depicting pSTAT5 and pS6 levels after reculture without cytokine or with IL-7 (A, bottom). Mean pSTAT5 and pS6 levels after reculture in 100 ng/mL of the indicated cytokine (n = 4, * p < 0.05, **** p < 0.0001). (B) BrdU was added for the final hour after overnight culture in the indicated cytokine (n = 10, **** p < 0.0001). (C) Cells were counted on days 0, 1, 2 and 3 post-replate in the indicated concentration of IL-7 in ng/mL (results are from 1 experiment with 2 replicates and are representative of at least 3 independent experiments). (D–F) Tc0 and Tc1 cells were analyzed for the indicated cytokine receptors via flow cytometry. (D) Representative histograms and (E) MFI ratios (*** p < 0.001, **** p < 0.0001; p-values represent significantly different from Tc0, which is indicated by the dashed line). (F) The percentage of cells expressing each cytokine receptor are shown (n = 11 independent experiments, *** p < 0.001 via Welch’s t-test). (G) The percentage of cells expressing IL-7Rα on days 2 and 3 after stimulation (n = 7, **** p < 0.0001 for all comparisons with Tc1 Day 3, ns for others).

