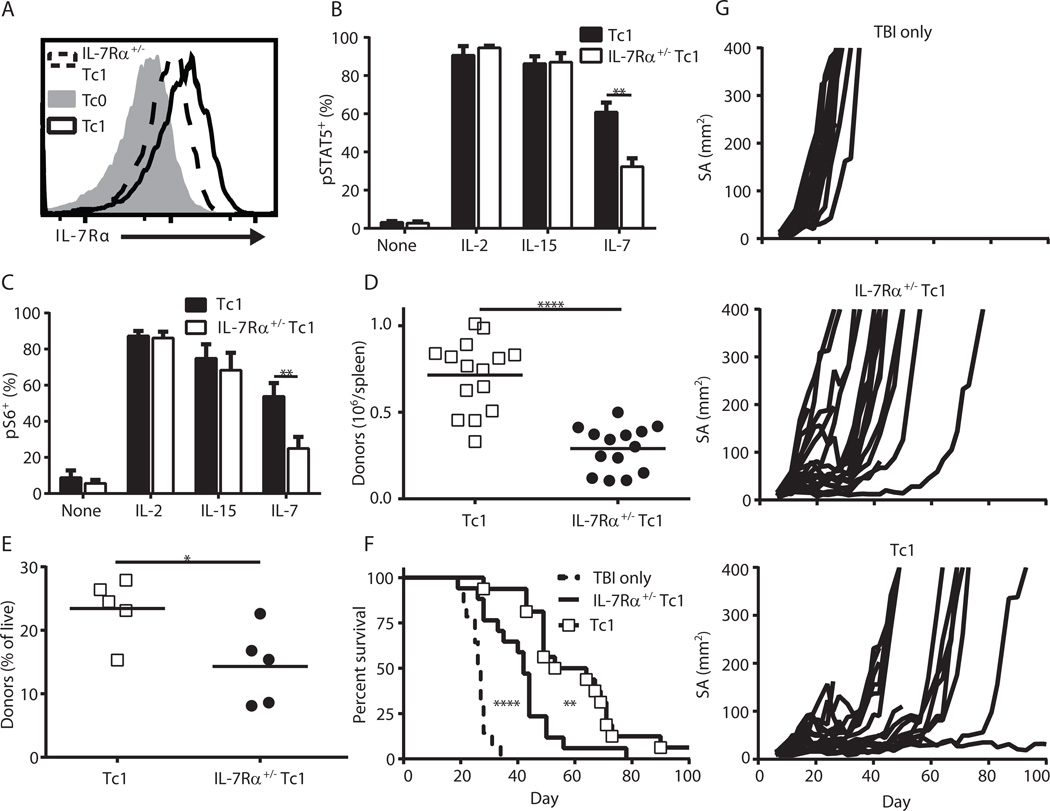
Figure 4. IL-7Rα expression is required for maximal expansion and anti-tumor efficacy of Tc1 cells.
(A) Representative histogram of IL-7Rα levels in Tc0, Tc1 and IL-7Rα+/− Tc1 cells. (B) pSTAT5 and (C) pS6 levels of Tc1 and IL-7Rα+/− Tc1 cells after replate in 100 ng/mL of the indicated cytokine (n = 4–6, ** p < 0.01). (D) 3–5×10⁶ pmel Tc1 or IL-7Rα+/− Tc1 cells were transferred into irradiated hosts (6 Gy), and the absolute number of donor cells in host spleens 7 days later is displayed (data is combined from 3 independent experiments, **** p < 0.0001). (E–G) Day 12 B16 tumor-bearing mice were injected with 2×10⁶ T cells the day after irradiation. (E) The percentage of donor cells in the peripheral blood on day 8 post-transfer (* p < 0.05). (F) Survival curves (**** p < 0.0001 for TBI only vs. IL-7Rα+/− Tc1, ** p < 0.01 for IL-7Rα+/− Tc1 vs. Tc1; combined from 2 independent experiments for total n = 14–17) and (G) growth curves.

