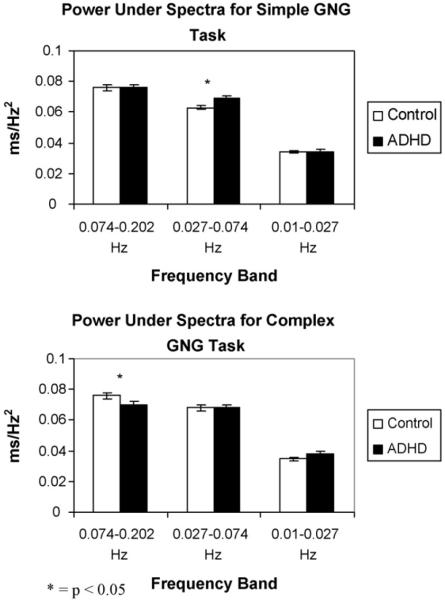
Fig. 2.
Illustration of the results of the FFT analyses. A significant main effect for band was seen, such that both groups of children showed increased power in the shorter wavelength bands (p < 0.001). There was also a significant task by diagnosis interaction (p = 0.04); follow-up analyses revealed that for the simple Go/No-go task, children with ADHD showed significantly increased power compared to controls in the 0.027–0.074 Hz band (p = 0.01), while in the complex task, children in the control group showed significantly increased power compared to children with ADHD in the 0.074–0.202 Hz band (p = 0.02).

