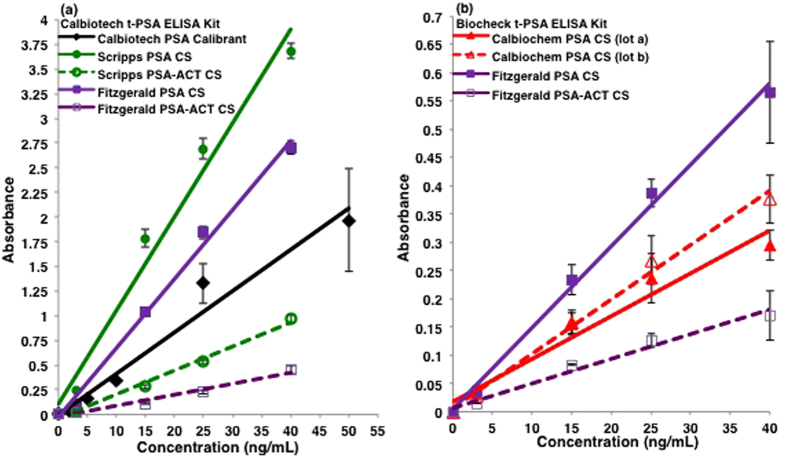
Figure 2. Calbiotech and Biocheck t-PSA ELISAs of free and complexed PSA CS.
Lower absorbance values were observed with the PSA-ACT CS in comparison to the PSA CS in both the (a) Calbiotech and (b) Biocheck t-PSA immunoassays. One standard deviation is shown for each plotted test point. In both immunoassays, the measured absorbance values for all of the PSA and PSA-ACT standards were different.

