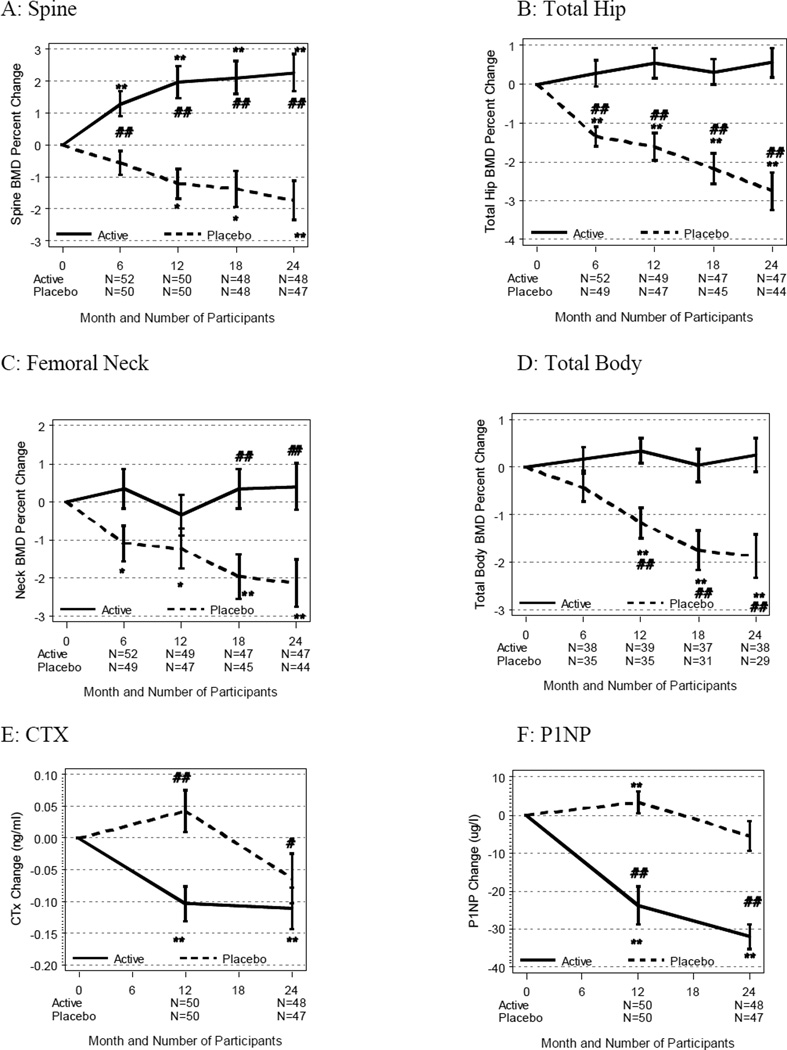
Figure 2.
Mean ± SE percent change in bone mineral density in spine (A), total hip (B), femoral neck (C), total body (D) and the absolute change in biochemical markers of bone turnover including CTX [(E), nmol/L BCE] and P1NP [(F), µg/mL] from baseline to 24 months (unadjusted). * p<0.05, ** p<0.01 change from baseline using paired t-test. #p<0.05, ##p<0.01 for comparison between risedronate (solid line) and placebo (dashed line) groups using linear mixed models.

