Figure 2.

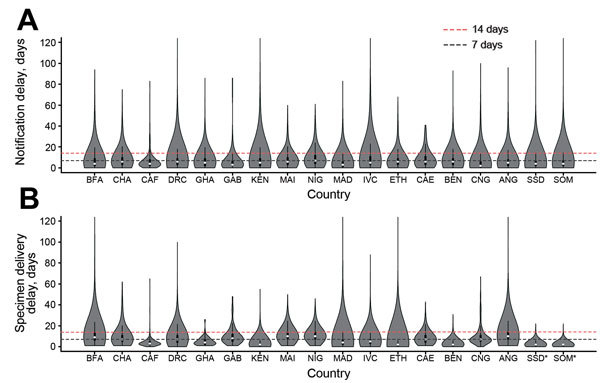
Distribution (violin plots) of time delays in notification of acute flaccid paralysis (AFP) cases and in sending samples for laboratory testing, by country, Africa, 2010–2013. A) Delay between onset of acute flaccid paralysis and notification of cases. B) Delay between notification of acute flaccid paralysis cases and the date collected stool samples were sent to a global polio laboratory. Asterisks (*) indicate that the date stool samples were sent to the laboratory was not available; in these instances, the date of the second stool collection was used instead. In the violin plots, white dots correspond to the median value, the rectangle indicates the interquartile range, and the vertical line corresponds to the range between upper and lower adjacent values. ANG, Angola; BEN, Benin; BFA, Burkina Faso; CAE, Cameroon; CAF, Central African Republic; CHA, Chad; CNG, Republic of the Congo; DRC, Democratic Republic of the Congo; ETH, Ethiopia; GAB, Gabon; GHA, Ghana; IVC, Côte D’Ivoire; KEN, Kenya; MAD, Madagascar; NIG, Niger; SOM, Somalia; SSD, South Sudan.
