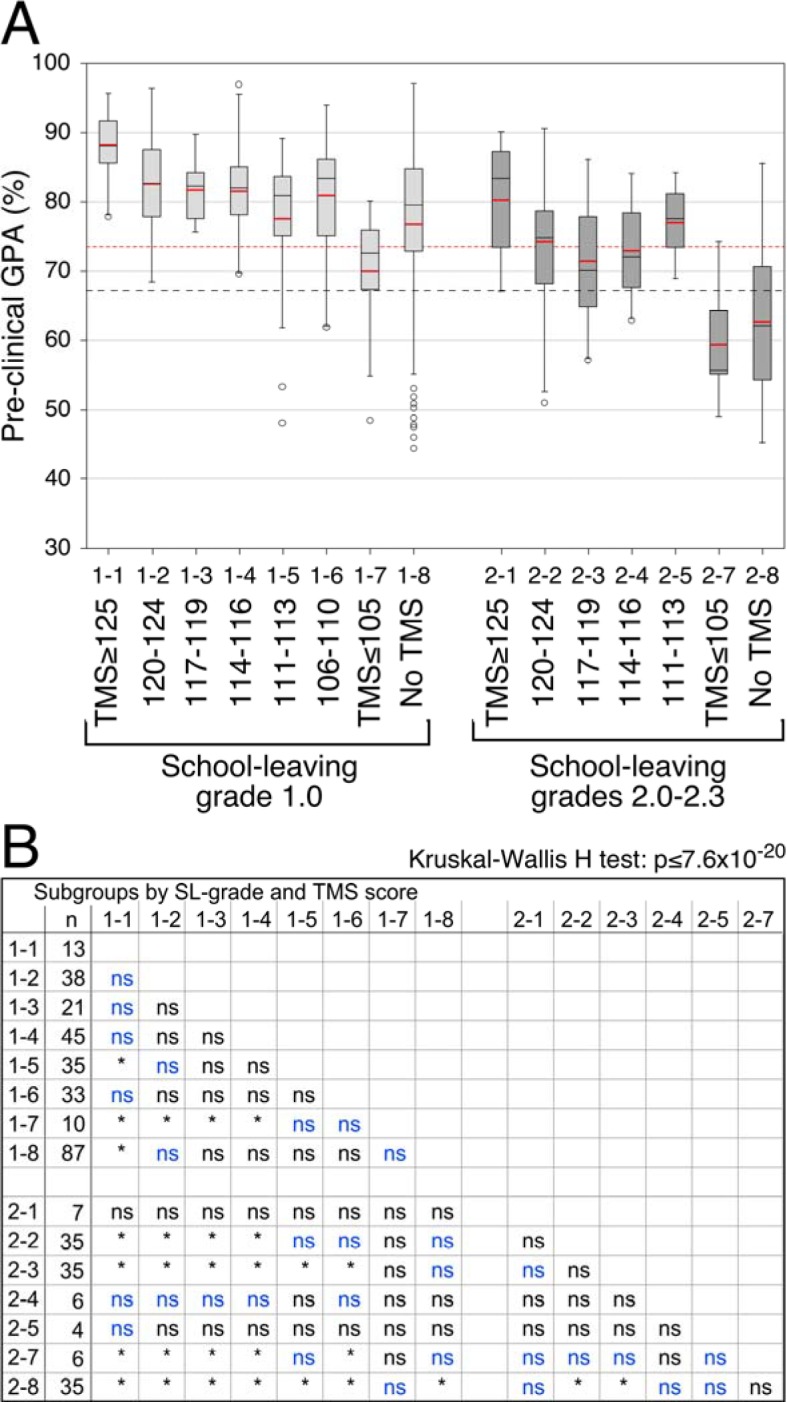
Figure 2. Academic performance by school-leaving grade and TMS score. A. Boxplots by TMS categories. The subgroups are denoted by a group number (1 or 2) and a subgroup number (1 to 8). The mean values are superimposed in red. Red and black broken lines: Mean and 25 percentile, respectively, of the performance of the mediocre school leavers with TMS>105. B. Kruskal-Wallis H test with pairwise post-hoc comparisons by Mann-Whitney U test with global α=0.05 and Holm-Bonferroni correction for multiple comparisons. *Significant at α=0.05; (n) number of cases; (ns) not significant; (blue print) significant prior to the Holm-Bonferroni correction.

