Figure 4.
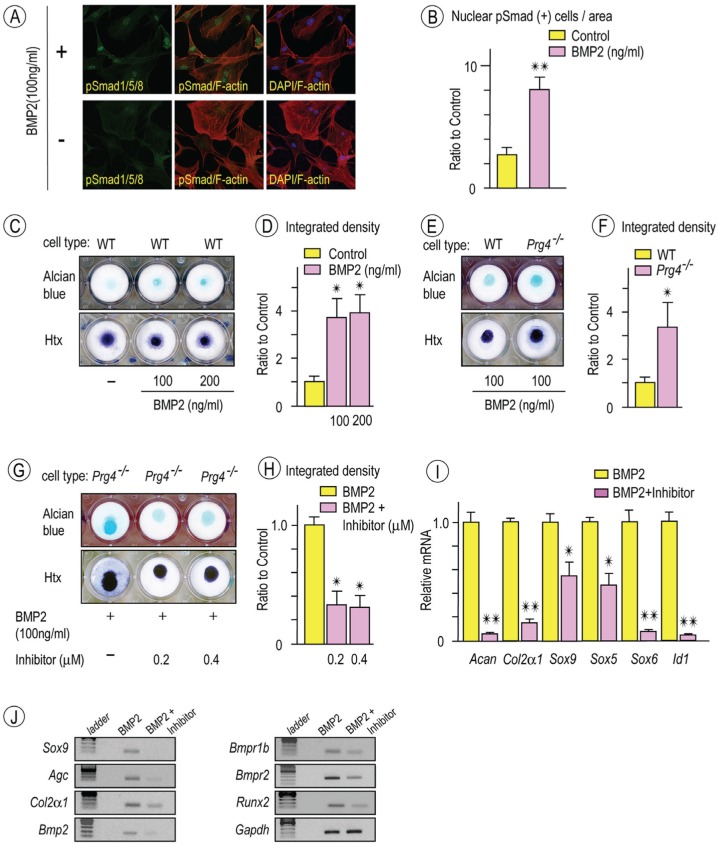
Chondrogenic potential of Prg4-/- disc cells stimulated by recombinant human bone morphogenetic protein 2 (rhBMP-2) and attenuated by bone morphogenetic protein (BMP) inhibitor. Disc cells from 2-mo-old wild-type (WT) mice were plated on coverslips and grown in serum-starved Dulbecco’s modified Eagle’s medium for 12 h. Cultures were then stimulated with rhBMP2 for 30 min, fixed, and incubated with a rabbit phosphorylated Smad 1/5/8 (pSmad1/5/8) primary antibody followed by anti-rabbit Alexa Fluor 488 (green), with rhodamine phalloidin for staining the actin cytoskeleton in cells (red; A, upper panel). Culture without rhBMP2 treatment were served as controls (A, lower panel). DAPI stains were used to detect nuclei (blue). Images of pSmad1/5/8 (green) or DAPI (blue) were merged with rhodamine phalloidin-stained cytoskeletal images (red). Disc cells with pSmad1/5/8 in the nucleus were counted in randomly selected 6 to 8 areas (approximately 15 to 20 cells/area; n = 5, **P < 0.01) and presented as average ± SD (B). Day 10 micromass cultures of WT disc cells stimulated with rhBMP-2 (100 or 200 ng/mL) exhibited increased alcian blue staining compared with control cultures (C, upper panel; n = 4). Micromass cultures were also counterstained with hematoxylin (Htx) to reveal the presence of cells in cultures (C, lower panel). Integrated density of alcian blue–stained cultures was measured (D; n = 4, *P < 0.05). Day 10 micromass cultures of Prg4-/- disc cells stimulated with rhBMP-2 (100 ng/mL; E, upper panel) revealed increased alcian blue staining compared to WT disc cells (E, upper panel). Htx counterstaining (E; lower panel). Integrated density of alcian blue–stained cultures were measured (F; n = 4, *P < 0.05). Micromass cultures of Prg4-/- disc cells were treated with rhBMP-2 (100 ng/mL) alone or rhBMP-2 (100 ng/mL) / LDN-193189 (BMP inhibitor) at indicated concentration (G). Alcian blue staining (G, upper panel) and Htx counterstaining (G; lower panel). Integrated density of alcian blue–stained cultures was measured (H; n = 4, *P < 0.05). Histograms depicting relative expression of chondrocyte makers, Sox5, Sox6, Sox9, and BMP target were decreased in BMP inhibitor-treated cultures as compared with controls (I; n = 3, *P < 0.05, **P < 0.01). Semiquantitative reverse transcription polymerase chain reaction revealed decreased expression of chondrocyte markers, Bmp2, Bmp receptors, and Runx2 in Prg4-/- discs as compared with controls (J). Graphs depict mean ± SD. Control data were set as 1 (D, F, H, I).

