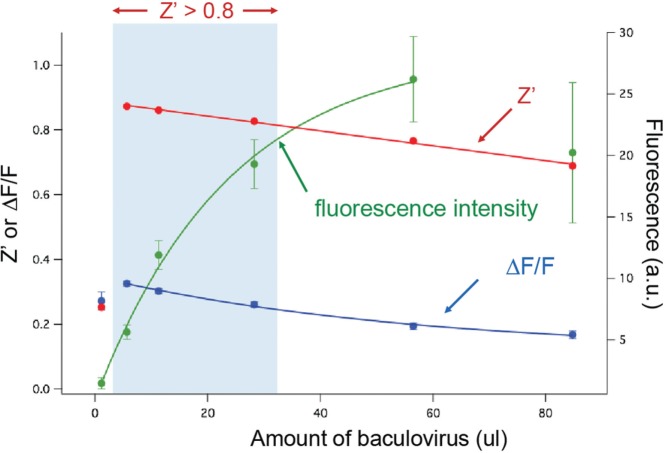
Figure 2.
The Z′ performance of the Downward DAG3 sensor as a function of baculovirus concentration in HEK 293T cells. Systematically varying the baculovirus added to each well makes it possible to explore the relationship between sensor expression, total fluorescence, fluorescence change, and Z′. In the case of the Downward DAG3 sensor, the addition of virus from 1 to 60 µL produced a monoexponential rise in the total fluorescence in each well. As the sensor fluorescence rises, however, there is a concomitant drop in the ΔF. Accordingly, there is an assay window ranging from 5 to 35 µL of virus that produces an optimum Z′ of greater than 0.8, and additional virus degrades the assay performance.

