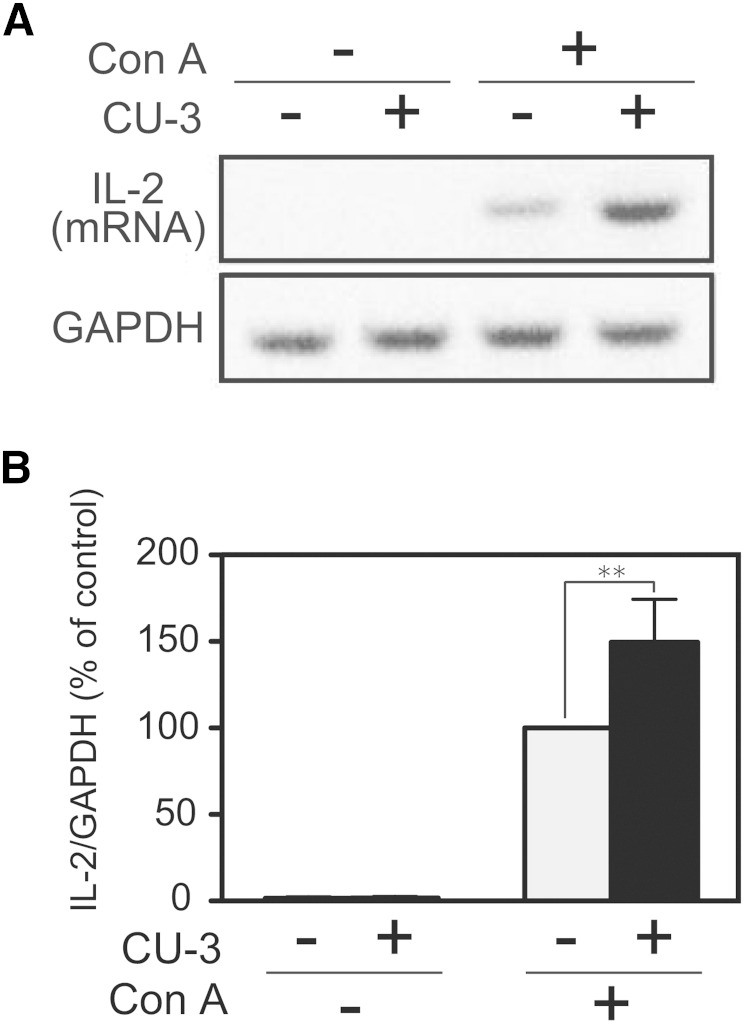
Fig. 10.
Effect of CU-3 on the IL-2 production of Jurkat T cells. A: Jurkat T cells were preincubated in 35 mm culture dishes filled with 2 ml RPMI in the presence or absence of CU-3 (5 μM) for 5 min. Con A was then added to the media, and the cells were further incubated for 3 h. Total RNA was reverse transcribed into cDNA, and PCR amplification (34 cycles) was performed using primers for IL-2 or GAPDH. The PCR products were then separated by agarose gel electrophoresis and visualized with ethidium bromide. The visualized bands were digitized and quantified using Adobe Photoshop and NIH Image software. B: The value in the presence of Con A and in the absence of CU-3 was set to 100%. The values are presented as the mean ± SD (n = 5). ** P < 0.01.

