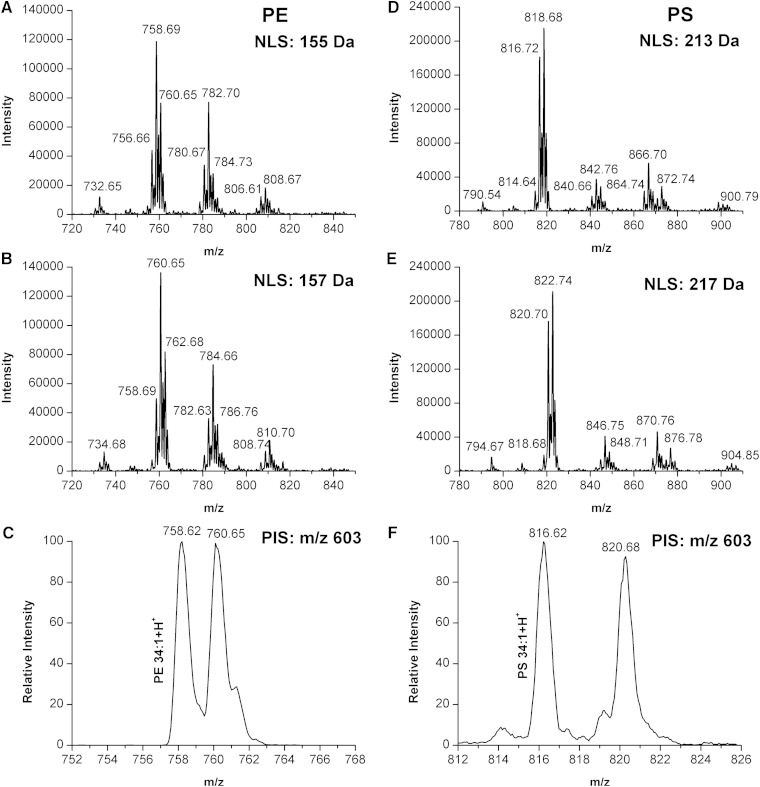
Fig. 5.
NLS- or PIS-based ESI-MS/MS analysis for the mixture of 1H- and D-labeled PLs at 1:1 ratios. A: NLS of 155 Da for identification and quantification of 1H-labeled PE species from the mixture of 1H- and D-labeled PLs at 1:1 ratios. B: NLS of 157 Da for identification and quantification of D-labeled PE species from the mixture of 1H- and D-labeled PLs at 1:1 ratios. C: PIS of m/z 603 for identification and quantification of 1H- and D-labeled PE 34:1 from the mixture of 1H- and D-labeled PLs at 1:1 ratios. D: NLS of 213 Da for identification and quantification of 1H-labeled PS species from the mixture of 1H- and D-labeled PLs at 1:1 ratios. E: NLS of 217 Da for identification and quantification of 1D-labeled PS species from the mixture of 1H- and D-labeled PLs at 1:1 ratios. F: PIS of m/z 603 for identification and quantification of 1H- and D-labeled PS 34:1 from the mixture of 1H- and D-labeled PLs at 1:1 ratios. The expected 1:1 intensity ratios and the 2 or 4 Da shift for PE and PS, respectively, are also evident. The monoisotopic peak was employed for quantification.

