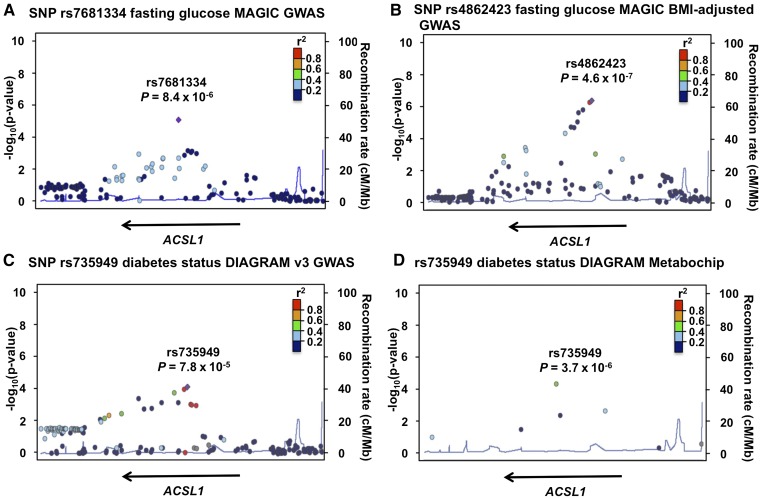
Fig. 1.
Regional association plots for statistically significant SNPs identified through candidate association studies in ACSL1 in published results from genetic consortia. SNP rs7681334 association with fasting glucose in the original MAGIC GWAS (A), SNP rs4862423 association with fasting glucose in the MAGIC BMI-adjusted GWAS (B), SNP rs735949 association with diabetes status in DIAGRAM v3 GWAS (C), and SNP rs735949 association with diabetes status in DIAGRAM Metabochip (D). The plots are generated using LocusZoom with 1000 Genomes CEU as the reference for calculating linkage disequilibrium.

