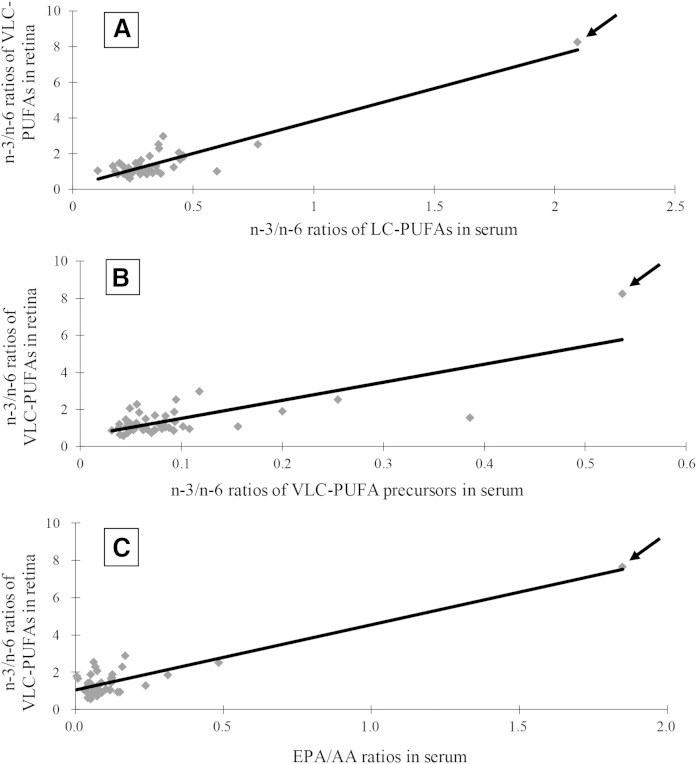
Fig. 2.
Correlation of n-3/n-6 LC-PUFA ratios in serum with the n-3/n-6 ratios of VLC-PUFAs in retina (r = 0.91; P < 0.001) (A). Correlation of n-3/n-6 of VLC-PUFA precursor ratios in serum with the n-3/n-6 ratios of VLC-PUFAs in retina (r = 0.76; P < 0.001) (B). Correlation of EPA/AA ratios in serum with the n-3/n-6 ratios of VLC-PUFAs in retina (r = 0.92; P < 0.001) (C). The arrows correspond to data points from an outlier donor who consumed 7 g of fish oil daily for 18 months prior to death.

