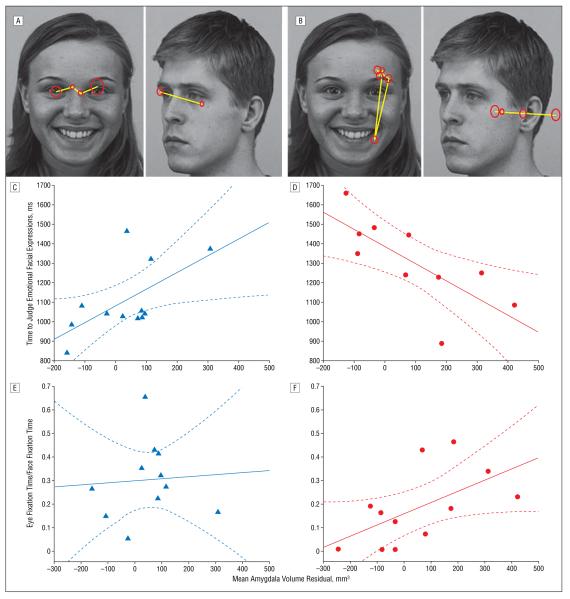
Figure 2.
A small amygdala volume predicts face-processing abnormalities in individuals with autism. Example task stimuli show gray scale images from a standardized picture set depicting emotional and neutral facial expressions. The overlay depicts representative visual scanning (yellow lines) and fixations (red circles; the diameter reflects duration) from a typically developing individual (A) and an individual with autism (B). Behavioral performance is plotted against residual variance in mean amygdala volume after correction for age and brain volume in a control individual (C) and in an individual with autism (D). In C, judgment times for emotional stimuli are positively correlated with the mean amygdala volume (r=0.61, P=.02) in the control group, but this is not significant after removal of an outlier at 300 mm3 and 1375 milliseconds (r=0.46, P=.16). In D, judgment times are slower for emotional stimuli in the autism group but are strongly correlated with amygdala volume (r=−0.73, P=.02). This correlation differs significantly from the control correlation (without outlier: z=2.8, P=.002). Eye fixation time as a fraction of total face fixation time per trial is unrelated to amygdala volume in controls (r=0.07, P=.80) (E), but positively correlates with amygdala volume in the autism group (r=0.58, P=.049) (F) such that individuals with the least eye fixation have small amygdalae. In C-F, the solid line indicates the line of best fit; the broken lines, the 95% confidence interval.

