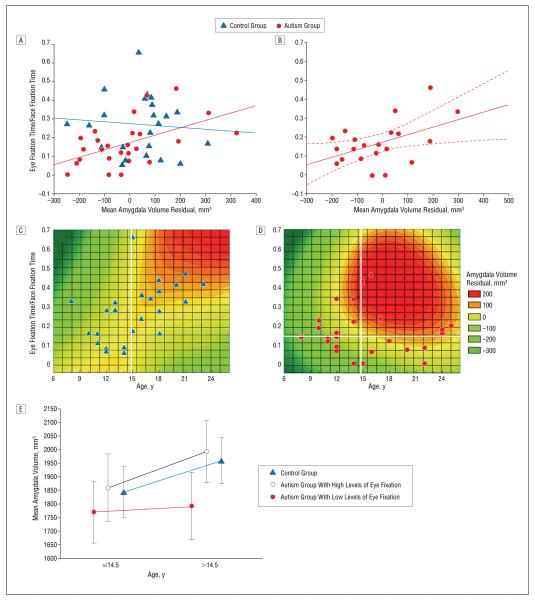
Figure 5.
Decreased amygdala volume in autism is a product of age and degree of nonverbal social impairment. In A, age- and brain volume–corrected amygdala volumes were combined across studies and plotted against eye fixation fraction for each group. The 2 measures are unrelated in the combined control group (r=−0.08, P=.70) but are significantly correlated in the combined autism group (r=0.52, P=.01); these correlations are significantly different (z=2.2, P=.01). In B, the relationship remains significant when IQ is included as a covariate (r=0.48, P=.03). Eye-fixation fraction was used as an indicator of nonverbal social functioning to examine its relationship with age-related differences in amygdala volume. In C, although eye fixation does not predict amygdala volume in control individuals, a spline-interpolated contour plot of amygdala volume (corrected for brain volume) with respect to age and eye fixation fraction shows that amygdala volume and eye fixation increase with age. In D, a similar plot for the autism group shows that individuals with high levels of eye fixation do show an age-related increase in amygdala volume, but those with low levels of eye fixation have similar amygdala volumes throughout this age range. For visualization, the sample was split by median age (vertical white lines in C and D), and the autism group was further divided by eye fixation (horizontal white line in D). In E, the mean±95% confidence interval–corrected amygdala volume for the 3 populations is shown for younger and older participants.

