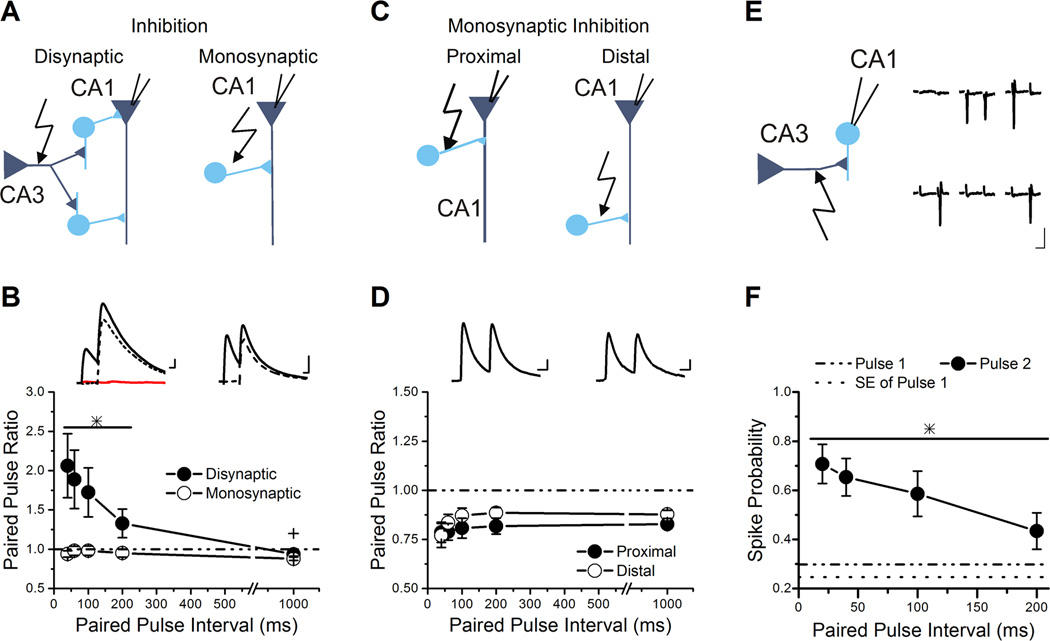
Figure 1. Disynaptic inhibition shows paired-pulse facilitation due to recruitment of interneurons.
A, Schematics for recordings of disynaptic inhibition (left) and monosynaptic inhibition (right), with interneurons as circles and pyramidal neurons as triangles.
B, Group results for paired-pulse ratios of IPSCs plotted against the paired-pulse interval show that disynaptic inhibition facilitates (n=18) while monosynaptic inhibition depresses (n=16). The line and * over a subset of data points indicates the values that are significantly different from monosynaptic inhibition and from baseline. The + over the 1000 ms interval of disynaptic inhibition indicates that the value is significantly different from baseline and expresses slight paired-pulse depression. Inset: Example traces of disynaptic (left) and monosynaptic (right) IPSCs recorded from pyramidal neurons held at 0 mV to remove the AMPA receptor component and isolate the inhibitory current. Disynaptic inhibition is blocked by application of 10 µM NBQX (flat line on the left insert). Solid lines are original traces and dashed lines are the traces after subtraction of the first pulse. Scale Bars: 20 ms, 50 pA (top), 50 pA (bottom).
C, Schematic for recordings of monosynaptic inhibiton from proximal and distal stimulation.
D, Group results for paired-pulse ratios of monosynaptic IPSCs plotted against the paired-pulse interval for proximal (open triangle, n=11) and distal (closed diamond, n=8) stimulation. No significant difference was seen. Inset: Example traces of proximal (left) and distal (right) monosynaptic IPSCs. Scale Bars: 20 ms, 25 pA
E, Left: Schematic of the cell-attached recording of s. radiatum interneurons. Right: Example traces from cell-attached recording onto an interneuron in s. radiatum during paired-pulse stimulation at 100 ms interval show responses with spikes and no spike. Stimulus artifacts have been removed. Traces are in chronological order, but are not sequential, because trials cycled through a series of paired-pulse intervals, so there were intervening trials at different intervals (not shown). Scale Bars: 20 ms, 5 pA.
F, Group results for the spike probability plotted against the paired-pulse interval (n=11). The spike probability is enhanced 2-fold at the shorter paired-pulse intervals compared to the spike probability on the first pulse. The line and * over the data points indicates the values that are significantly different from pulse 1.

