
Extended Data Figure 8. PVT1 and MYC co-localize in the SK-BR-3 nuclei.
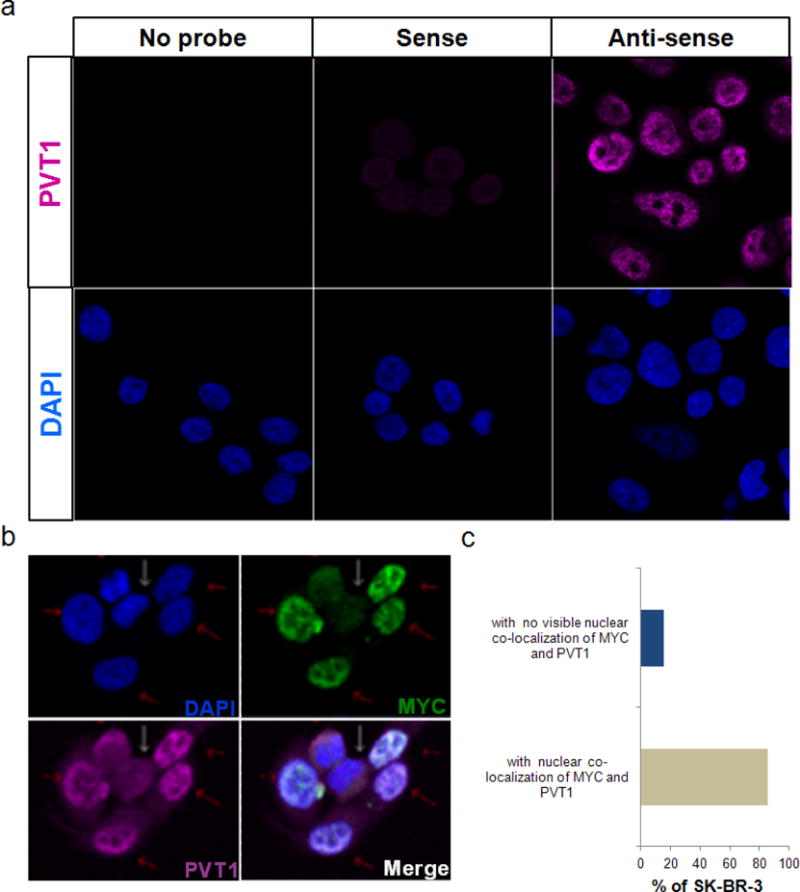
a, Specificity of fluorescent-labelled anti-PVT1 RNA probe in SK-BR-3 cells. Fluorescent images of SK-BR-3 cells treated with no probe, sense and anti-sense PVT1 RNA probe. DAPI (blue) stain is shown in the lower panel. b, c, Expression and co-localization of MYC and PVT1 in SK-BR-3 nuclei. Representative fluorescent images of SK-BR-3 cells treated with fluorescently labelled anti-MYC antibody (green) and anti-PVT1 RNA (magenta) (b). DAPI indicating cell nuclei is shown in blue. Cells expressing MYC and PVT1 are indicated by red arrows whereas those expressing low levels of MYC and PVT1 are indicated by white arrows. Merge panel represents overlapping images of DAPI, MYC and PVT1 panels. The nuclei with co-localization of MYC and PVT1 are shown by red arrows. c, Quantification of SK-BR-3 nuclei with co-localization of MYC and PVT1 (n = 87).