
Extended Data Figure 9. Incidence MYC and PVT1 co-gain in human cancers.
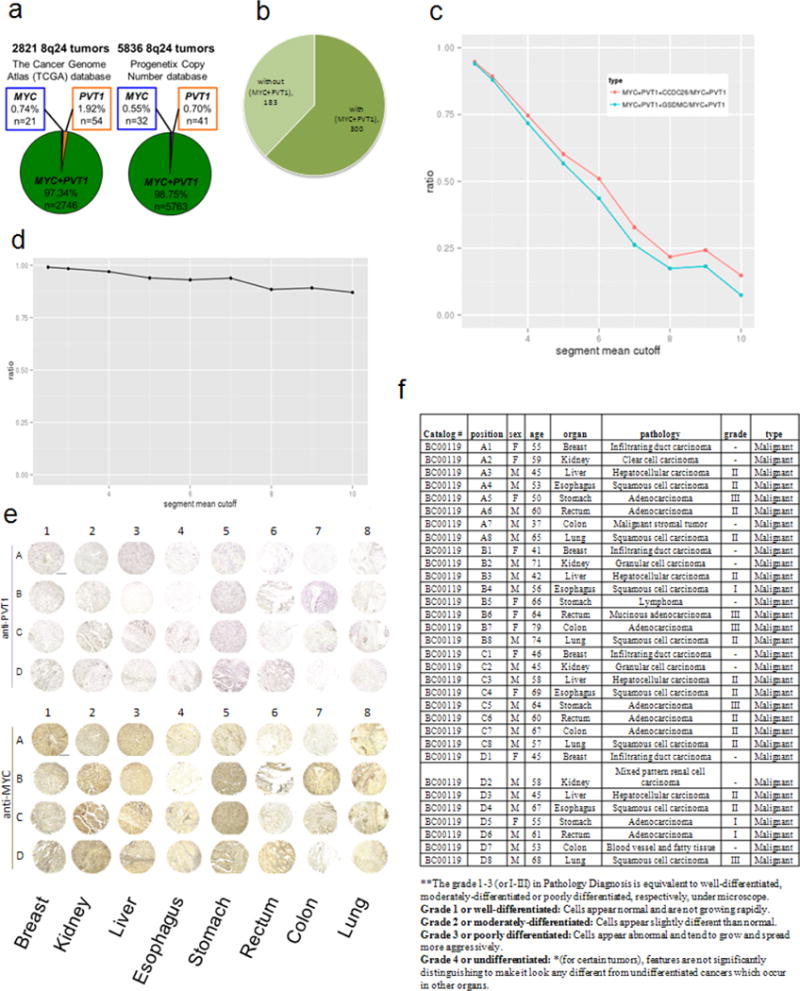
a, Number of 8q24 gain-associated human cancers showing gain of MYC but not PVT1 (blue), gain of PVT1 but not MYC (orange) and co-gain of MYC + PVT1 (green) in TCGA (left) and Progenetix copy-number database (right). b, Pie chart showing breast cancer samples in TCGA expressing high HER2 transcript with or without co-gain of MYC + PVT1. c, The ratio of MYC + PVT1 + CCDC26 and MYC + PVT1 + GSDMC co-amplification among MYC + PVT1 co-gained TCGA samples at different amplification levels (segment mean cutoff). d, The ratio of MYC + PVT1 co-amplification among MYC-gained cancers on different segment mean cutoffs. e, f, Tissue microarray analysis of PVT1 RNA and MYC protein expression in primary human tumours. Images of 32 primary human tumours showing in situ hybridization using digoxigenin-labelled PVT1 probe (purple, top panel) and MYC immunohistochemistry using anti-MYC antibody (brown, bottom panel) (e). f, Specification of multiple organ normal and diseased tissue microarray, single core per case, eight types of tumour (breast, colon, oesophagus, kidney, liver, lung, rectum, stomach) (BC00119).