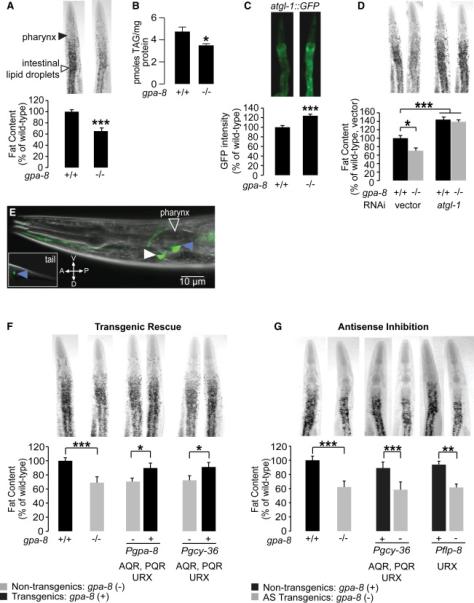
Figure 1. G protein signaling from the body cavity neurons stimulates body fat loss.

(A) Representative images are shown of wild-type and gpa-8 animals fixed and stained with oil Red O (upper panels). Fat deposition in the intestinal cells is visible as stained lipid droplets (white arrowhead). Animals are oriented facing upwards with the pharynx (black arrowhead) at the anterior end. Fat content was quantified for each genotype and is expressed as a percentage of wild-type animals ± SEM (lower panels; n=20). ***, p<0.001 by Student's t-test.
(B) Biochemical extraction and quantitation of triglycerides was conducted for wild-type and gpa-8 animals. gpa-8 animals have a significant reduction in triglycerides compared to wild-type animals. *, p<0.05 by Student's t-test.
(C) Representative images are shown of wild-type animals and gpa-8 mutants bearing an integrated atgl-1::GFP transgene (upper panels). The fluorescence intensity of atgl-1 expression was quantified and is expressed as a percentage of wild-type animals ± SEM (lower panels; n=10). ***, p<0.001 by Student's t-test.
(D) Representative images are shown of RNAi-treated wild-type animals and gpa-8 mutants fixed and stained with oil Red O (upper panels). Fat content was quantified for each genotype and condition and is expressed as a percentage of wild-type animals grown on vector RNAi ± SEM (lower panels; n=12). *, p<0.05 and ***, p<0.001 by two-way ANOVA.
(E) Fluorescent image of a transgenic animal bearing a gpa-8::GFP transgene. Blue arrowheads indicate expression in AQR and PQR neurons and the white arrowhead indicates expression in URX. A, anterior; P, posterior; V, ventral; D, dorsal.
(F) Representative images are shown of wild-type animals and gpa-8 mutants fixed and stained with oil Red O (upper panels). For each transgenic line bearing gpa-8 expression using the indicated promoter, non-transgenic animals (−) and transgenic animals (+) are shown. Relative to non-transgenic controls (gray bars), transgenic animals (black bars) bearing the gpa-8 transgene under the control of the endogenous gpa-8 and the heterologous gcy-36 promoters restore body fat content to that seen in wild-type animals. Data are expressed as a percentage of body fat in wild-type animals ± SEM (lower panels; n=20-24). *, p<0.05 and ***, p<0.001 by Student's t-test.
(G) Representative images are shown of animals bearing antisense (AS)-mediated inactivation of gpa-8. For each transgenic line bearing gpa-8 antisense using the indicated promoter, nontransgenic animals (+) and transgenic animals (−) are shown. Relative to non-transgenic controls (black bars), transgenic animals (gray bars) bearing gpa-8 antisense under the heterologous gcy-36 and flp-8 promoters recapitulate the decreased body fat seen in gpa-8 mutants. Data are expressed as a percentage of body fat in wild-type animals ± SEM (n=10-12). **, p<0.01 and ***, p<0.001 by Student's t-test. See also Figure S1.
