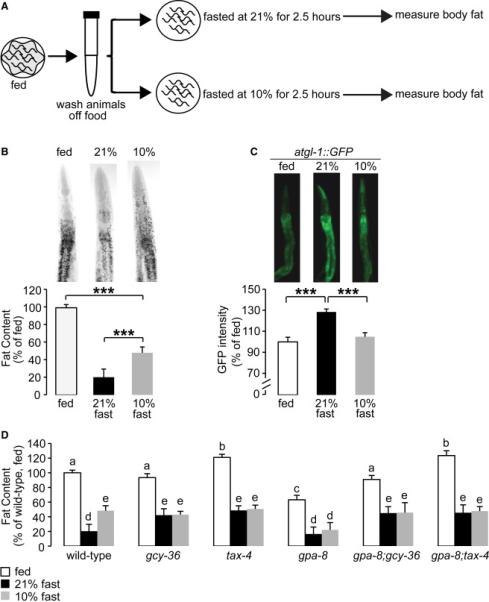
Figure 3. Oxygen-sensing via the body cavity neurons controls the extent of fat mobilization in the periphery.

(A) Schematic depiction of the oxygen-dependent fat loss assay. L1 worms were seeded and grown to adulthood on food. Day 1 adults were washed off food over a period of 30 minutes. Worms were then seeded onto plates without food. Worms were then subjected to a fasting period at either 21% or 10% oxygen for an additional 2.5 hours. At the end of the fasting period, worms were fixed and stained with oil Red O.
(B) Wild-type worms were subjected to the fasting assay described in (A). Representative images are shown of fed or fasted wild-type worms, subjected to different O2 concentrations, fixed and stained with oil Red O (upper panels). Data are expressed as a percentage of body fat in wild-type fed controls ± SEM (lower panels; n=20-21). ***, p<0.001 by one-way ANOVA.
(C) atgl-1::GFP worms were subjected to the fasting assay described in (A). The fluorescence intensity of atgl-1 expression was quantified and is expressed as a percentage of wild-type fed controls ± SEM (n=10-15). ***, p<0.001 by one-way ANOVA.
(D) Worms of the indicated genotypes were subjected to the fasting assay described in (A). Fat content was quantified for each genotype and condition. Data are expressed as a percentage of body fat in wild-type fed controls ± SEM (n=12-25). Each genotype was compared to wild-type by one-way ANOVA. Different letters indicate statistical significance. Letters shared in common among groups indicates no significant difference. Groups labeled with “a” were not significantly different from wild-type fed animals. Groups labeled with “b” (p<0.01) and “c” (p<0.001) represent significant differences within the fed condition compared to wild-type. Groups labeled with “d” (p<0.001) and “e” (p<0.01) represent significant differences within the fasted conditions compared to wild-type. See also Figures S2 and S3.
