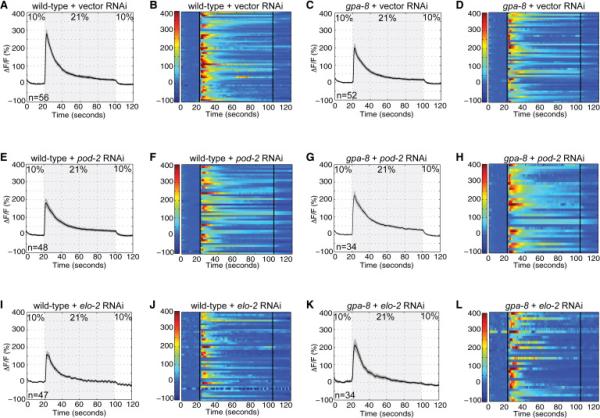
Figure 5. The activation of URX neurons is modulated by internal fat reserves, in a GPA-8-dependent manner.

(A, C, E, G, I, K) Measurements of neuronal activity by Ca2+ imaging of URX neurons for each genotype and condition. The number of animals for each condition is given in the figure. We conducted Ca2+ imaging in vector, pod-2, or elo-2 RNAi-treated wild-type and gpa-8 mutant animals bearing GCaMP5k under the control of the flp-8 promoter. Oxygen concentrations in the microfluidic chamber were 10% and 21% as indicated. Black traces show the average percent change of GCaMP5k fluorescence (ΔF/F0) and gray shading indicates SEM. Average ΔF/F0 at the depicted oxygen concentrations in (A, E, I) wild-type animals or (C, G, K) gpa-8 mutants treated with vector control RNAi (top row), pod-2 RNAi (middle row), or elo-2 RNAi (bottom row). (B, D, F, H, J, L) Individual URX responses are shown for each genotype and condition; each row represents one animal. See also Figure S5.
