. 2015 Sep 13;1(2):107–115. doi: 10.18053/jctres.201502.001

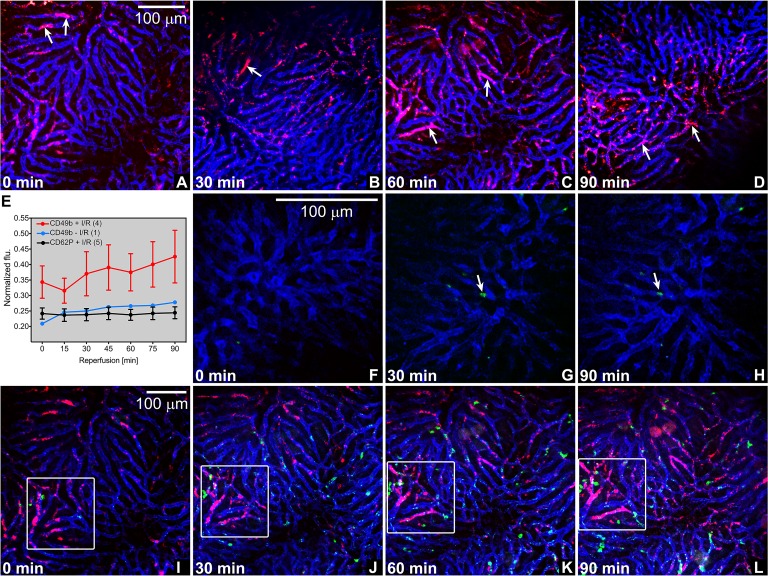
Figure 1. Intravital imaging of platelet aggregation and platelet activation status following hepatic I/R in mice. (A-D) Platelet aggregates (red (CD49b), arrows) in hepatic microcirculation (blue, CD31) as a function of reperfusion time (left bottom, all imaging panels). Representative panels are shown per time point, taken from the video footage of 3 animals. Scale bar applies to all panels. (E) The mean pixel intensity per fluorescence channel (y-axis) was quantitated for each time point (x-axis) for every experimental group (resting platelets following I/R (CD49b + I/R), resting platelets in sham-operated animals (CD49b – I/R), and activated platelets following I/R (CD62P + I/R)) using FiJi/ImageJ software. Platelet fluorescence (flu) was normalized to endothelial fluorescence (mean ± SEM, sample size is given in parentheses in the legend). (F-H) Absence of P-selectin staining (green, CD62P) in post-ischemic liver microcirculation (blue, CD31). Incidental P-selectin-positive foci are indicated with arrows, corresponding to the same location at different reperfusion times. (I-L) Absence of platelet (red, CD49b) and neutrophil (green, Gr1) colocalization in post-ischemic hepatic microcirculation (blue, CD31). The quadrant corresponds to the same location at different reperfusion times, whereas the time lapse series in I-L correspond to panel C. Note the gradual increase in platelet aggregation in the demarcated region in this animal.

Figure 1.