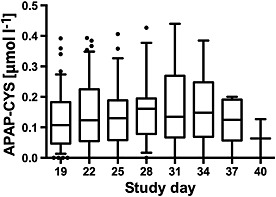
Figure 2.

Serum paracetamol–cysteine (APAP‐CYS) concentrations during the extended dosing period (days 17–40) in subjects administered 4 g day–1 paracetamol during the study. The line in each figure represents the median value; the box includes the 25th–75th percentile; the ‘whiskers’ include the 10th–90th percentile and the dots represent values outside the 10th–90th percentile. The number of subjects for each day were: day 19, n = 47; day 22, n = 47; day 25, n = 25; day 28, n = 17; day 31, n = 13; day 34, n = 6; day 37, n = 5; and day 40, n = 2
