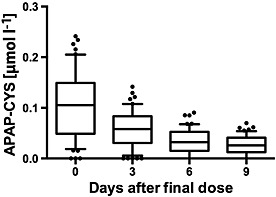
Figure 4.

Serum paracetamol–cysteine (APAP‐CYS) concentrations in subjects during the resolution phase administration of 4 g day–1 paracetamol for 16 days. Subjects did not take paracetamol during this phase of the study. Day 0 of the resolution phase was day 16 of the baseline study. The line in each figure represents the median value; the box includes the 25th–75th percentile; the ‘whiskers’ include the 10th–90th percentile and the dots represent values outside the 10th–90th percentile
