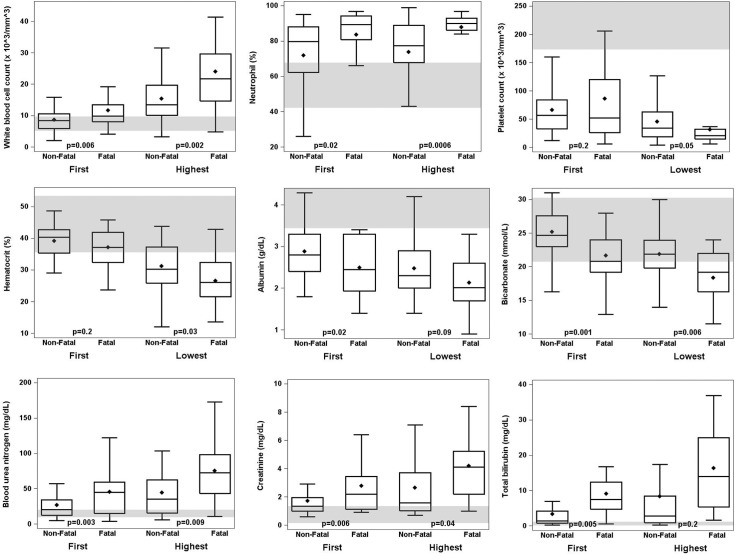
Fig 4. Box plots of selected laboratory values of fatal (n = 21) and non-fatal (n = 52) leptospirosis patients included in a case-control study, Puerto Rico, 2010.
Medical records from all health care visits were abstracted, and first and worst laboratory values (S4 Table) were compared. The median value is indicated by the horizontal line within each box; mean value is indicated by the diamond; 25th and 75th interquartile range (IQR) are indicated by the bottom and top edges of the box, respectively; whiskers indicate the range of values within 1.5 times the value of the IQR. P values indicate statistical significant differences between fatal and non-fatal patients. Shaded horizontal lines indicate normal reference laboratory values.

