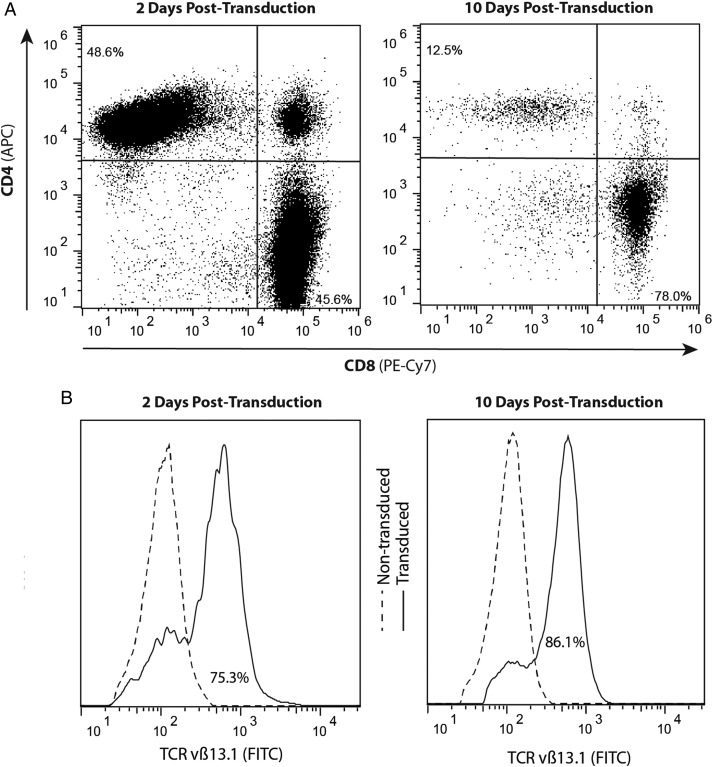
Fig. 2.
Retroviral transduction of the NY-ESO-1 TCR generates a high percentage of antigen-specific T cells, over a 10-day culture, prior to ACT. (A) Populations skew toward a CD3/CD8 cytotoxic T cell phenotype over 10 days of expansion. The percentages of CD8+ and CD4+ T cell populations were estimated by flow cytometry at 2 days (45.6% and 48.6%, respectively) and at 10 days (78.0% and 12.5%, respectively) following transduction and expansion in medium supplemented with 300 IU/mL of IL-2. APC, allophycocyanin. (B) Expression of TCRvβ13.1 by CD8+ T cells at 2 days (75.3%) and 10 days (86.1%) posttransduction compared with nontransduced T cells. Data shown are representative of one experiment repeated 4 times with similar findings. FITC, fluorescein isothiocyanate.

