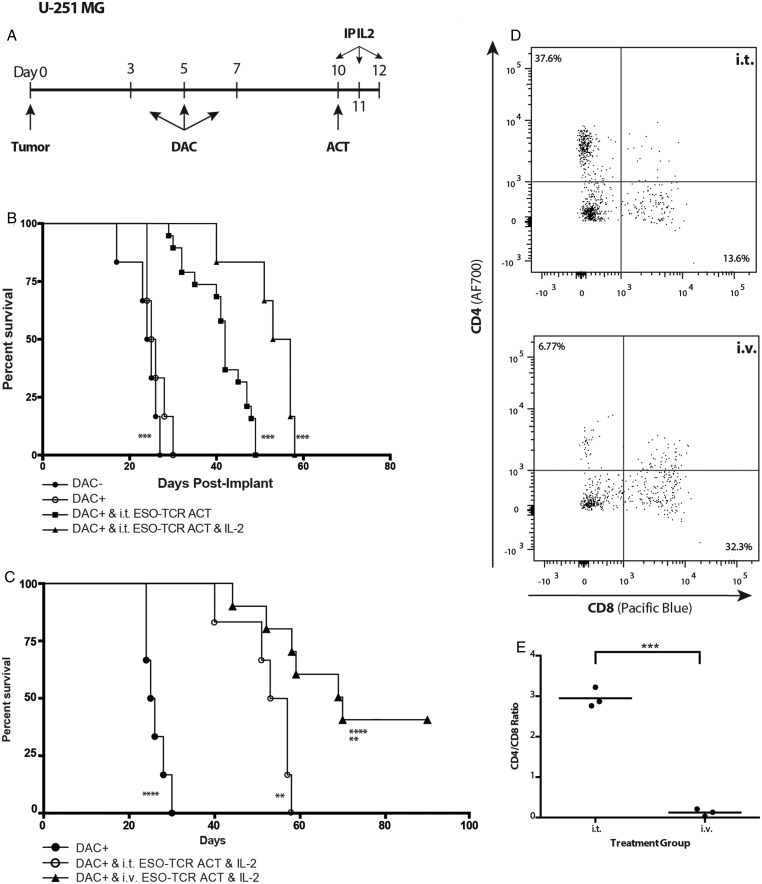
Fig. 6.
Systemic IL-2 support and i.v. route of delivery enhance the therapeutic benefit of NY-ESO-1–specific T cell adoptive transfer. (A) Treatment regimen. Mice were intracranially implanted with 2.5 × 10⁵ U-251MG glioma cells. At day 3 post tumor implantation, the animals were treated with 10 mg/kg DAC (DAC+) i.p. every other day for a total of 3 doses (days 3, 5, 7 post tumor implant). Three days following the last injection (day 10 post tumor implant), mice received i.t. adoptive transfer of NY-ESO-1 TCR engineered T cells followed by IL-2 (500 000 IU in 200 μL) or PBS 1× (200 μL) on days 10, 11, and 12 post tumor implant. (B) The mice were then followed for survival. Significant differences were noted between DAC+ and i.t. ESO-TCR ACT and IL-2 and DAC−, as well as between DAC+ and i.t. ESO-TCR ACT and IL-2 and DAC+ and i.t. ESO-TCR ACT groups (***P < .001, log-rank survival test and Cox proportional hazards model). (C) Three days following the final DAC injection (day 10 post tumor implant), experimental mice received i.t. or i.v. ACT of NY-ESO-1 TCR engineered T cells (i.t., 106 cells/2 μL; i.v., 107 cells/100 μL). Treated mice received i.p. injection of IL-2 (500 000 IU in 200 μL) on days 10, 11, and 12 post tumor implant. The mice were then followed for survival. Significant survival differences were observed between DAC+ and DAC+ and i.v. ESO-TCR ACT and IL-2, between DAC+ and i.t. ESO-TCR ACT and IL-2, and between DAC+ and i.v. ESO-TCR ACT and IL-2 (**P < .01, ****P < .0001, log-rank survival test and Cox proportional hazards model). The survival curves are each representative of one experiment repeated 3 times with similar findings. (D) On day 13 post tumor implant, mice were sacrificed and brain tumor–infiltrating lymphocytes harvested and stained by fluorescence activated cell sorting. The histograms depict representative animals after either i.t. (top) or i.v. (bottom) delivery. (E) The tumor-infiltrating lymphocytic population shows a significantly decreased CD4/CD8 ratio in the i.v.-treated group compared with the i.t.-treated group (***P < .001, Student's t-test).

