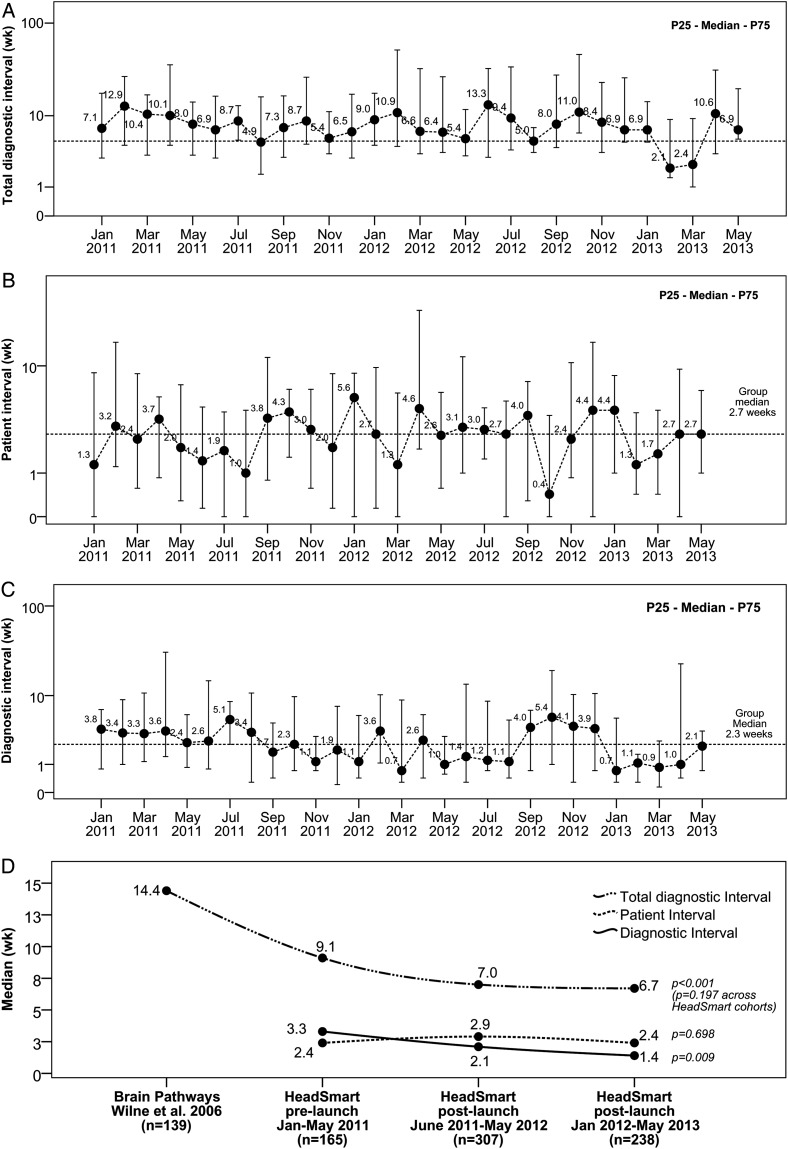
Fig. 3.
Monthly run charts of all patients diagnosed from 6 months before HeadSmart campaign launch (January 2011) to 2 years post-launch (May 2013) and a comparison across 3 time periods. (A) Total diagnostic interval, time from symptom onset to diagnosis; (B) patient interval, time from symptom onset to first presentation to health care professionals; (C) diagnostic interval, time from first presentation to health care to diagnosis; (D) comparison across 3 time periods.

