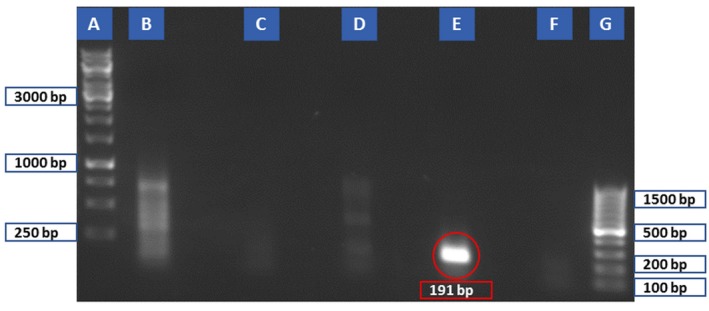
Figure 6.

Evaluation of primer set No. 2 on different lysed parasites. (A) 1 kb ladder, (B) T . gondii, (C) T . cati, (D) P . equorum, (E) T . spiralis as the positive control, (F) negative control, and (G) 100 bp ladder. Red colour circle shows 191 bp PCR product of primer set No. 2 on T . spiralis.
