
Figure 1.
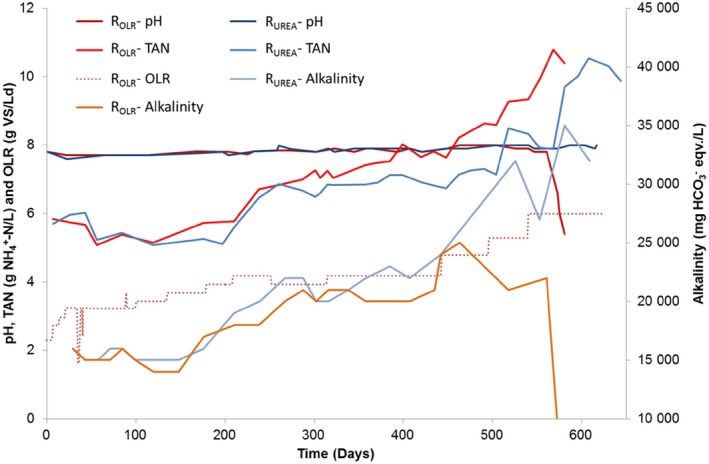
pH, alkalinity and TAN in reactors RUREA and ROLR. In addition, OLR is given for ROLR. Organic loading rate for RUREA is not shown but was identical to that for ROLR until day 100, and thereafter remained constant at 3.2 g VS L−1 day−1.
Official websites use .gov
A
.gov website belongs to an official
government organization in the United States.
Secure .gov websites use HTTPS
A lock (
) or https:// means you've safely
connected to the .gov website. Share sensitive
information only on official, secure websites.
pH, alkalinity and TAN in reactors RUREA and ROLR. In addition, OLR is given for ROLR. Organic loading rate for RUREA is not shown but was identical to that for ROLR until day 100, and thereafter remained constant at 3.2 g VS L−1 day−1.