
Figure 4.
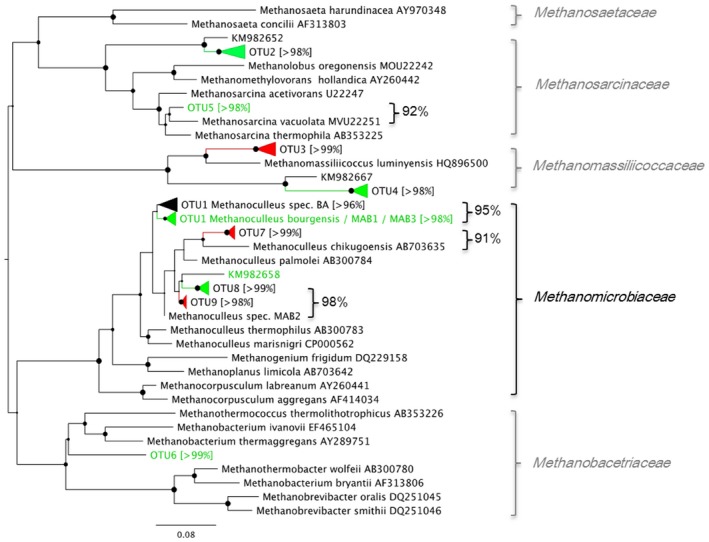
Phylogenetic tree constructed of sequences retrieved in the clone library of the mcrA gene. Operational taxonomic units retrieved from three different samples (start‐up and end point of each reactor), with theoretical T‐RF sequence lengths indicated in brackets. Green font indicates dominance in RUREA at end point, red indicates dominance in ROLR at end point, and black indicates similar abundance in both reactors at end point or throughout the experiment. Sequence identity is given (%) for selected genotypes.