
Figure 6.
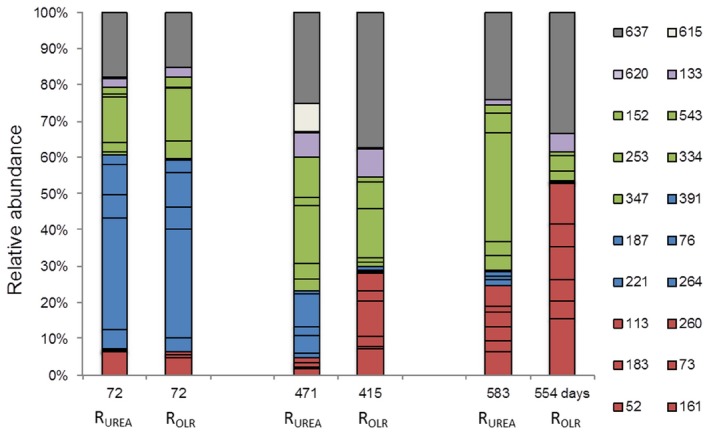
Terminal restriction fragment length pattern analysis of acetogens. Fraction of relative abundance for all sequences with a limit of > 3% relative abundance. Red: enriched in both reactors (but faster and with higher abundance under increasing OLR conditions). Blue: fading in both reactors. Green: increasing under urea dosage conditions (but fading slowly with OLR). Light purple: same behaviour under both conditions. Light brown: single peak. Grey: uncut genotypes.