
Figure 8.
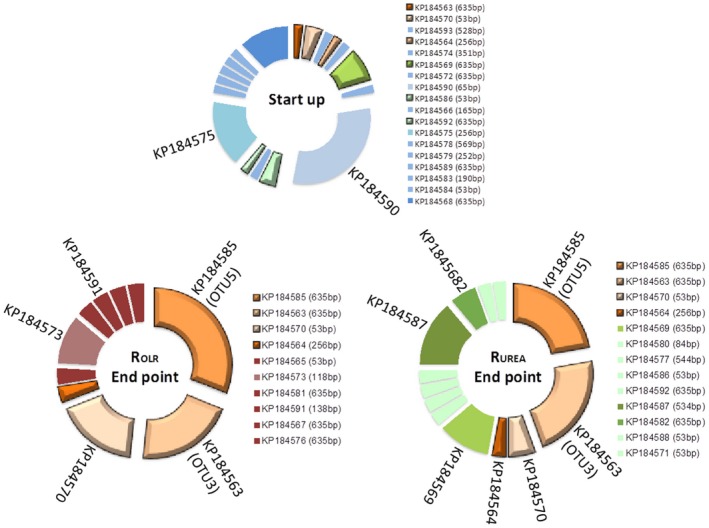
Correlation between T‐RFLP analysis and OTUs identified from clone libraries of the formyltetrahydrofolate synthetase (fhs) gene. Start‐up sample represents ROLR at day 72, before any changes were made in the experiment. End point represents day 554 in ROLR and day 583 in RUREA. Blue group – Fading from start‐up; Orange group – detected in both end point clone libraries; Green group – only detected in RUREA end point and Red group – only detected in ROLR end point.