
Figure 9.
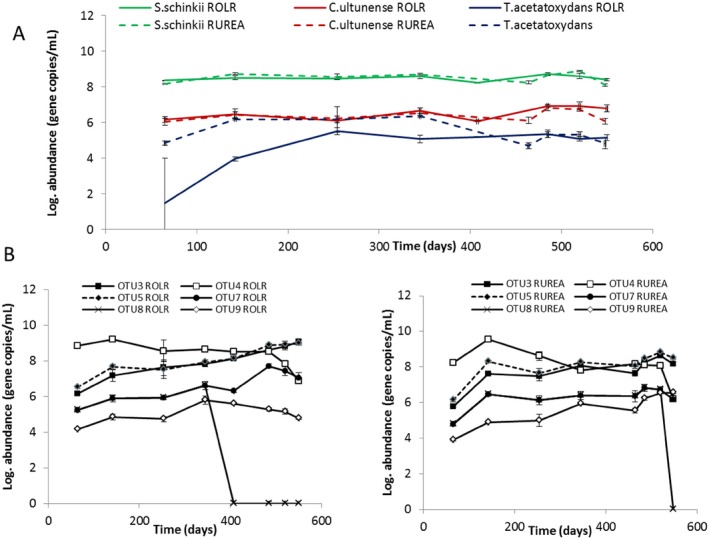
Log abundance of known SAOB (A) and OTUs representing potential SAOB for ROLR and RUREA (B).
Official websites use .gov
A
.gov website belongs to an official
government organization in the United States.
Secure .gov websites use HTTPS
A lock (
) or https:// means you've safely
connected to the .gov website. Share sensitive
information only on official, secure websites.
Log abundance of known SAOB (A) and OTUs representing potential SAOB for ROLR and RUREA (B).