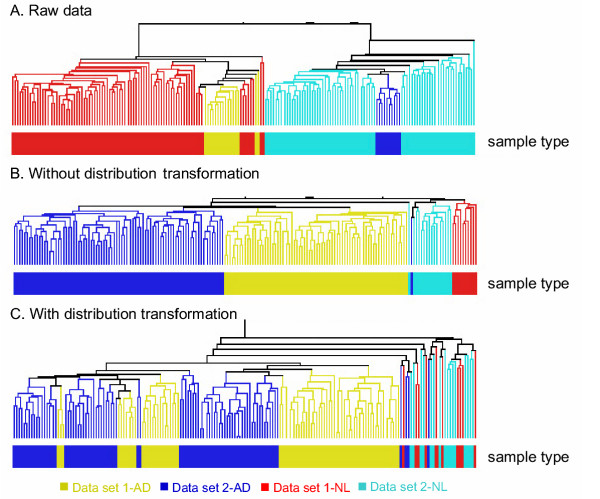
Figure 1.

Hierarchical Clustering Analysis of two data sets. A: raw data without any normalization, B: partial normalized data without distribution transformation, and C: partial normalized data with distribution transformation. AD and NL refer to adenocarcinomas (AD) patients and normal (NL) samples, respectively.
