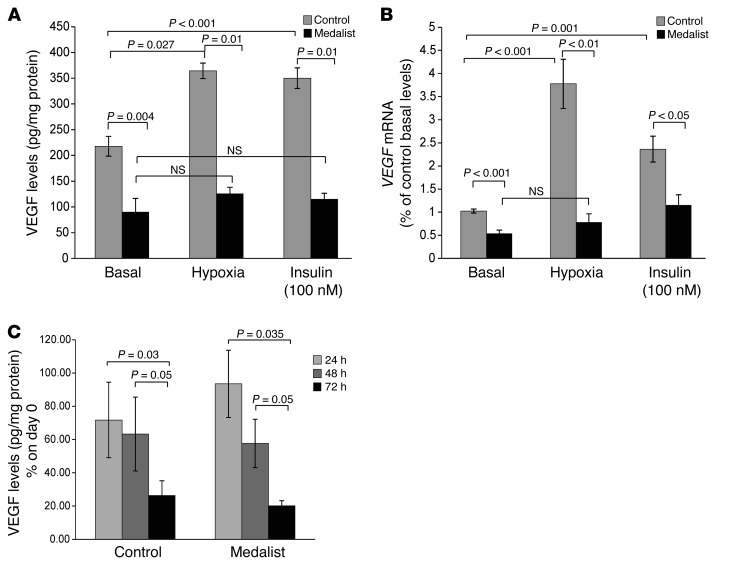
Figure 1. Effect of glucose, insulin, and hypoxia on VEGF expression.
Basal VEGF protein (A) and mRNA (B) levels (cells were incubated with DMEM medium only) after incubation with 100 nM insulin and after incubation for 16 hours under 5% O2 hypoxic conditions. VEGF protein levels secreted into the medium were measured using an ELISA kit, which determined mainly VEGF165. qPCR using the human VEGF primers detailed in Supplemental Figure 9 was performed to determine VEGF mRNA expression levels. Data represent the mean ± SD for 7 control subjects and 26 Medalists, each in triplicate. (C) VEGF protein expression after incubation of control and Medalist fibroblasts in 5.6 mM or 25 mM glucose for 24, 48, and 72 hours. Osmolality in 5.6 nM conditions was corrected using mannitol. A Student’s t test or χ2 test was used for 2-way comparisons based on the distribution and number of observations of the variable.

