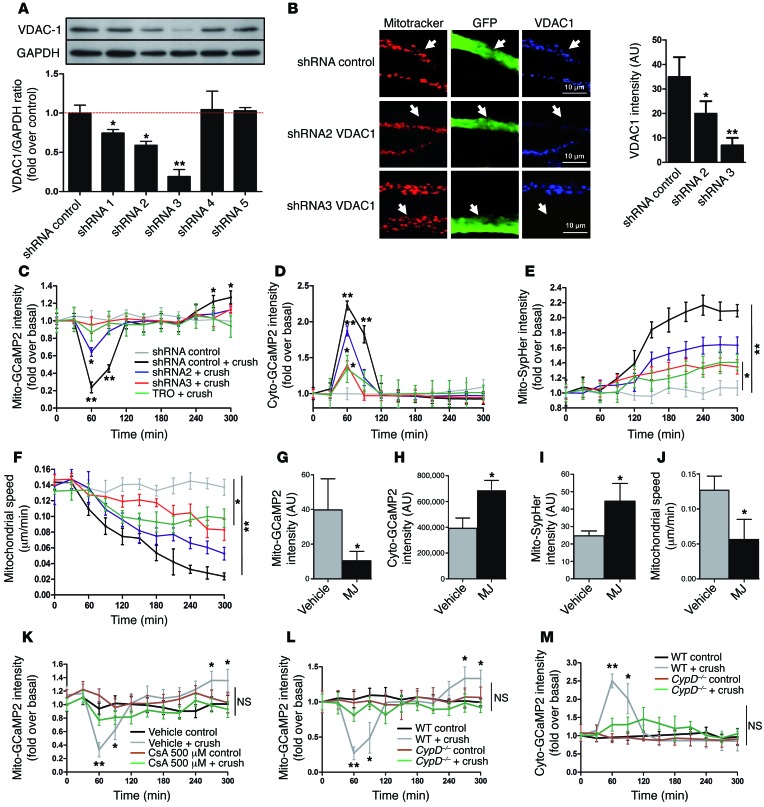
Figure 2. VDAC1 controls mitochondrial calcium release during demyelination.
(A) VDAC1 shRNA validation in vitro. Mouse MSC80 cells were transfected with plasmids expressing VDAC1 shRNAs, and VDAC1 protein amounts were quantified by Western blot. GAPDH was used as loading control. n = 4 independent experiments. (B) AAV-expressing VDAC1 shRNA 2 or 3 or control shRNA together with GFP (green, white arrows) was injected in mouse sciatic nerve (left). Cells expressing VDAC1 shRNAs express less VDAC1 (blue) in their mitochondria (red) than noninfected surrounding cells or cells expressing control shRNA. Scale bar: 10 μm. Quantification of VDAC1 fluorescence intensity in infected cells (right). (C) Mitochondrial calcium, (D) cytoplasmic calcium, (E) mitochondrial pH, or (F) mitochondrial motility changes in mSCs expressing control shRNA in control conditions (gray) or after crush (black) or expressing VDAC1 shRNAs 2 (blue) or 3 (red) after crush or treatment with TRO19622 (TRO) before crush (green). Asterisks mark statistical differences compared with noncrushed nerve. Quantification of (G) mitochondrial calcium, (H) cytoplasmic calcium, (I) mitochondrial pH, or (J) mitochondrial motility in mSCs 2 hours after vehicle or MJ treatment (3 mmol). (K) Mitochondrial calcium changes in mice treated with vehicle or 500 μM CsA 30 minutes before crush or in control conditions (noncrushed mice). (L) Mitochondrial calcium and (M) cytoplasmic calcium changes of WT and CypD–/– mice after crush or control conditions. Data are expressed as the mean ± SEM. n = 3–8 mice for each group. Asterisks mark statistical differences over control conditions (noncrushed nerve). *P < 0.05, **P < 0.01, 2-tailed Student’s t test, compared with noncrushed nerves.

