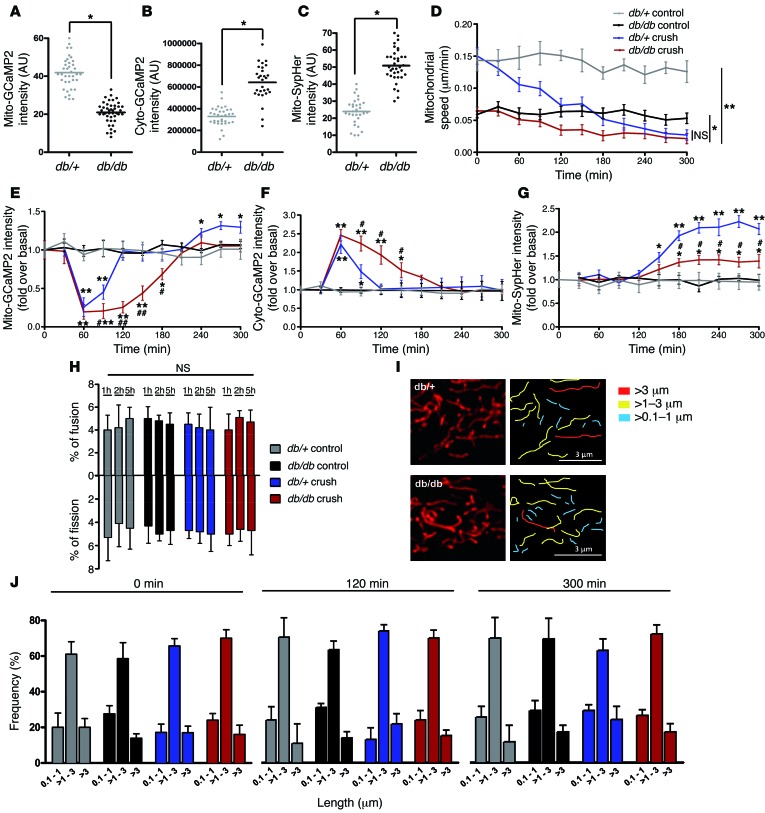
Figure 4. Mitochondrial physiology is altered in SCs of db/db diabetic mice.
(A) Mitochondrial calcium, (B) cytoplasmic calcium concentration, and (C) mitochondrial pH in mSCs of control (db/+) and diabetic (db/db) mice in basal conditions. (D) Mitochondrial motility, (E) mitochondrial calcium, (F) cytoplasmic calcium concentration, and (G) mitochondrial pH changes after crush or in control noncrushed conditions in mSCs of control and diabetic mice. (H) Ratio of mitochondrial fusion and fission events in mSCs of control and diabetic mice in crushed or control noncrushed conditions. (I) Representative images of mSC mitochondria (left panels) and mitochondrial length quantification (right panels) of control and diabetic mice after 300 minutes of time-lapse imaging acquisition. Scale bar: 3 μm. (J) mSC mitochondrial length frequency of control and diabetic mice in crushed or control conditions at different time points. No significant difference was found between control (db/+) and diabetic (db/db) mice. Data are expressed as the mean ± SEM. n = 3–6 mice. Asterisks and pound signs mark statistical differences compared with noncrushed control mice and crushed control mice, respectively. *P < 0.05, #P < 0.05, **P < 0.01, ##P < 0.01, 2-tailed Student’s t test.

