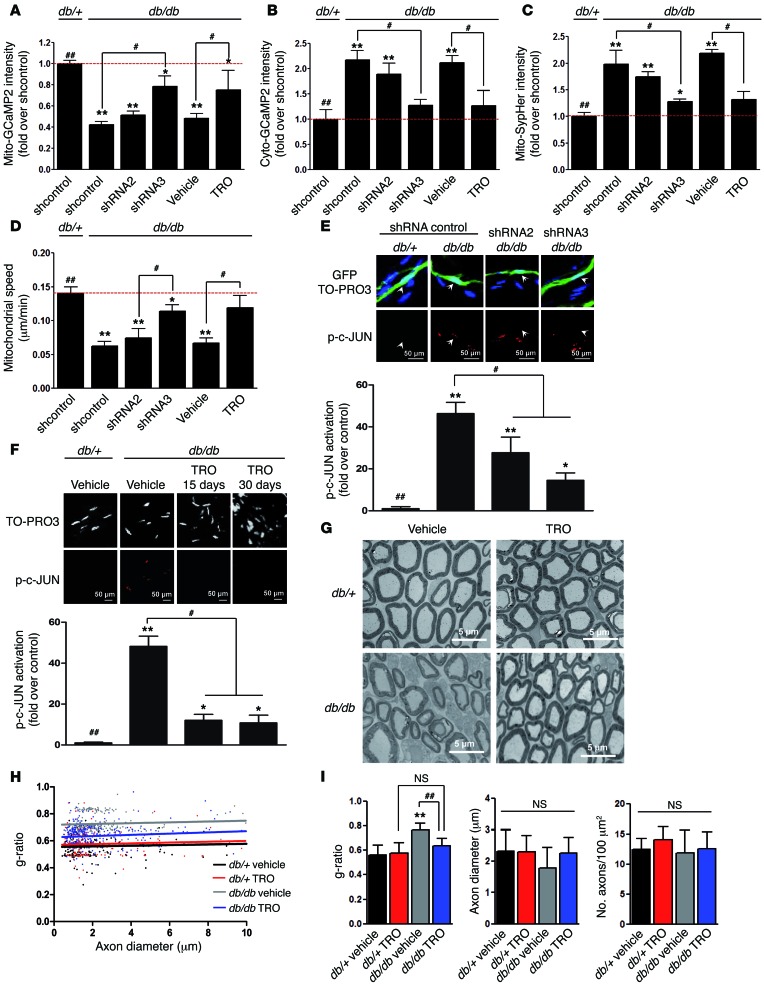
Figure 5. VDAC1 silencing and inhibition prevent SC mitochondrial anomalies and improve the phenotype of diabetic mice.
(A) Mitochondrial calcium, (B) cytoplasmic calcium, (C) mitochondrial pH, and (D) motility in mSCs of diabetic mice (db/db) in basal conditions are partially corrected during VDAC1 silencing or blocking. Immunohistochemistry for phospho–c-JUN in mSCs of control and diabetic mice after (E) VDAC1 silencing or (F) TRO19622 treatment. Arrows indicate infected mSC nuclei. Scale bar: 50 μm. Quantification of nuclear phospho–c-JUN represented as fold over control mice (db/+). Noninfected neighbor cells were used as internal controls. (G) Representative transmission electron micrograph images of sciatic nerve cross sections of control (db/+) and diabetic (db/db) mice after vehicle or TRO19622 treatment. Scale bar: 5 μm. (H) Scatterplot showing the g-ratio plotted against the axon diameter of control and diabetic mice treated with vehicle or TRO16922 for 30 days. (I) Average myelin g-ratio, axonal diameter, and number of myelinated axons in sciatic nerves of control and diabetic mice described in H. A minimum of 200 fibers was measured per animal. *P < 0.05, #P < 0.05, **P < 0.01, ##P < 0.01, 1-way ANOVA followed by a Dunnett’s multiple comparison post-hoc test.

