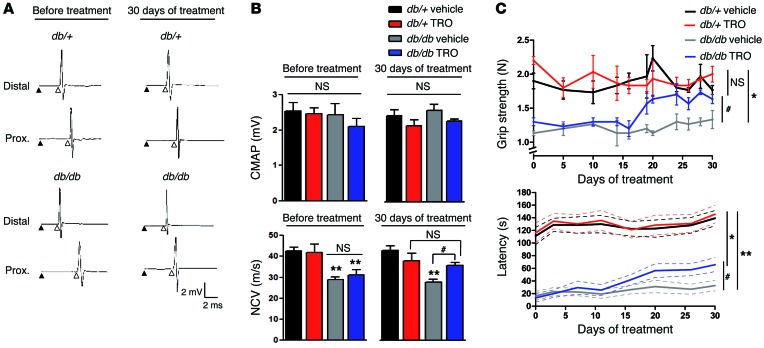
Figure 6. VDAC1 inhibition improves the phenotype of diabetic mice.
(A) Representative electrophysiological traces of sciatic nerve recording after distal and proximal stimulation of control and diabetic mice before and after TRO19622 treatment. The stimulus artifact (black arrowhead) and the onset of CMAP (white arrowhead) are shown. (B) Quantification of the CMAP and NCV from A. (C) Grip strength and rotarod latency of control and diabetic mice treated with vehicle or TRO19622. Data are expressed as the mean ± SEM. n = 12 mice for each group. Asterisks and pound signs mark statistical differences compared with control (db/+) mice and vehicle-treated diabetic mice, respectively. *P < 0.05, #P < 0.05, **P < 0.01, 1-way ANOVA followed by a Dunnett’s multiple comparison post-hoc test.

