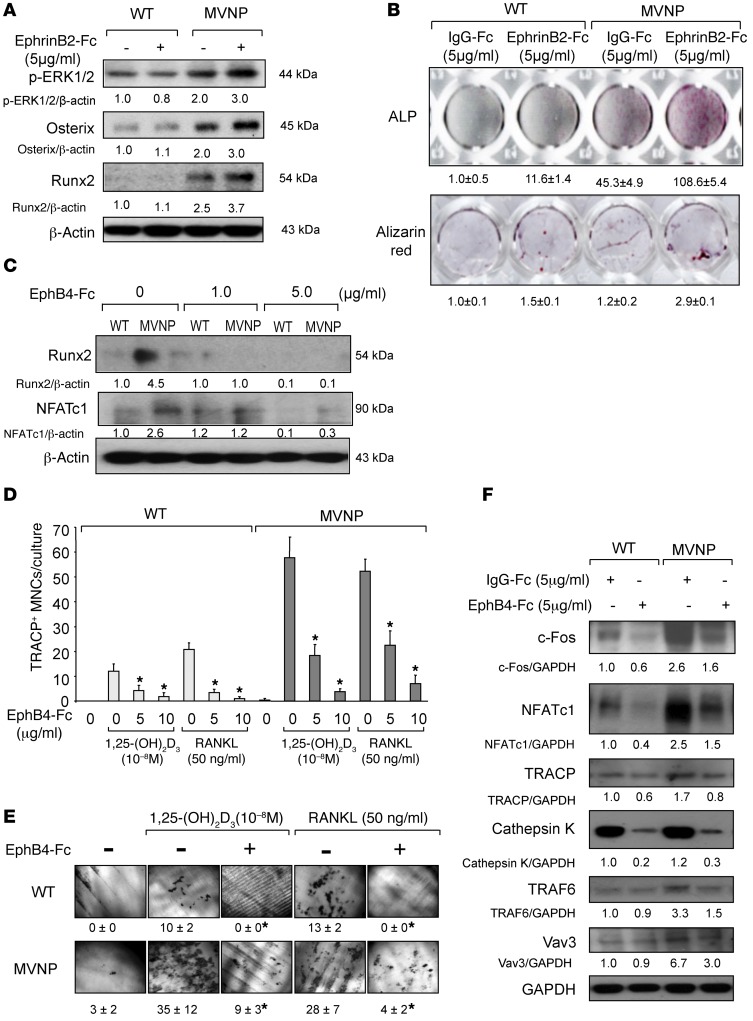
Figure 3. Effects of ephrinB2-Fc or EphB4-Fc on OB and OCL differentiation.
(A) OB precursors from WT and MVNP mice were treated with ephrinB2-Fc for 4 days and analyzed for p-ERK1/2, osterix, and Runx2. (B) OBs from WT and MVNP mice were cultured with control-Fc or ephrinB2-Fc and stained for ALP or alizarin red (26). ALP and alizarin red staining was quantitated by ImageJ software. The values for cultures treated with IgG-Fc were set at 1. Original magnification, ×1. (C) Cocultures of OBs and OCLs from WT and MVNP mice were treated with EphB4-Fc for 3 days and then analyzed for Runx2 or NFATc1 expression. (D) CD11b+ cells from WT and MVNP mice were cultured with M-CSF, followed by 1,25-(OH)2D3 or RANKL and EphB4-Fc or IgG-Fc and stained for TRACP. Data represent the mean ± SD. *P < 0.01 compared with cultures with IgG-Fc using 1-way ANOVA. (E) Resorption pits formed on dentin slices by OCLs cultured with 1,25-(OH)2D3 or RANKL with or without EphB4-Fc. Original magnification, ×250. Data are expressed as the percentage of resorption area (mean ± SD; n = 4 technical replicates). *P < 0.01 compared with control cultures using a 2-tailed, unpaired Student’s t test. (F) CD11b+ cells were cultured with EphB4-Fc or control IgG-Fc as described in Methods. Cell lysates were analyzed for c-Fos, NFATc1, TRACP, cathepsin K, TRAF6, and Vav3. Protein expression levels in Figure 3 were compared with β-actin or GAPDH by densitometry. The value of the ratio obtained in lysates from untreated WT OCLs compared with β-actin or GAPDH was arbitrarily set at 1. Results for Figure 3 (except E) are representative of 3 biological replicates.

