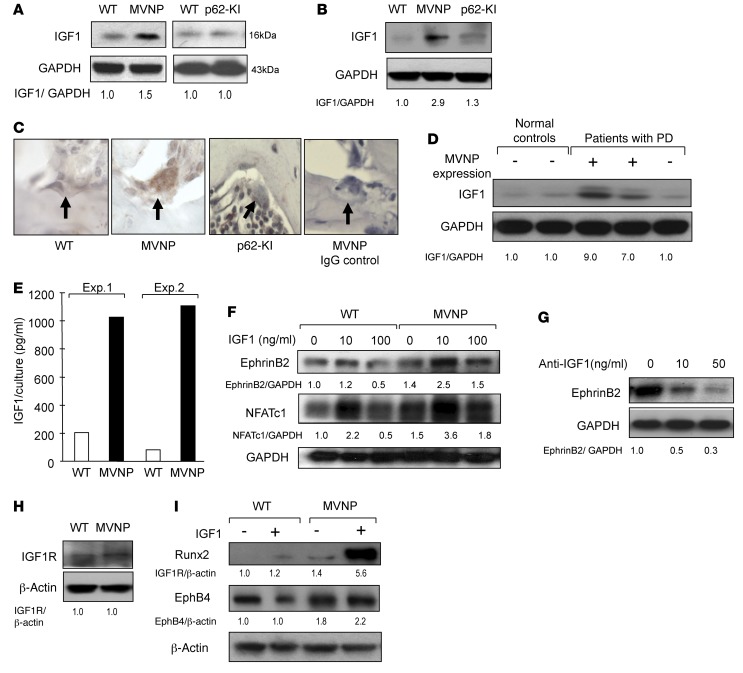
Figure 5. Increased IGF1 expression by MVNP-expressing OCLs.
(A) Bone lysates were analyzed for IGF1 expression. (B) OCLs formed by CD11b+ cells from 8-month-old WT, MVNP, and p62-KI mice were analyzed for IGF1 expression. (C) Vertebral sections from 12-month-old WT, p62-KI, and MVNP mice were stained with anti-IGF1 or control IgG. Only OCLs from MVNP mice positively stained for IGF1. Original magnification, ×400. (D) IGF1 expression in OCLs from normal donors or patients with PD. The results shown in D are derived from the same gel shown in Figure 2. (E) IGF1 levels in OCL-conditioned media using an ELISA kit. Results represent the mean of 5 technical replicates from 2 biological replicates. (F) EphrinB2 and NFATc-1 expression in OCLs formed by CD11b+ cells treated with IGF1 for 4 days. (G) OCLs from PD patients were cultured with anti-IGF1 for 48 hours and the cell lysates assayed for ephrinB2 expression. (H) IGF1R expression on OCLs formed by CD11b+ cells were prepared as in B. (I) OBs were prepared as described previously (26), cultured with IGF1 for 3 days, and analyzed for EphB4 or Runx2 expression. Results for Figure 5 (except E) are representative of 3 biological replicates. The basal ratio of every molecule/loading control for vehicle treatment of WT cells was set at 1.0 in A, B, D, and F–I. Staining of OCLs from MVNP and WT mice (scored as positive or negative) showed positive anti-IGF1 staining in OCLs from MVNP, but not WT, mice.

