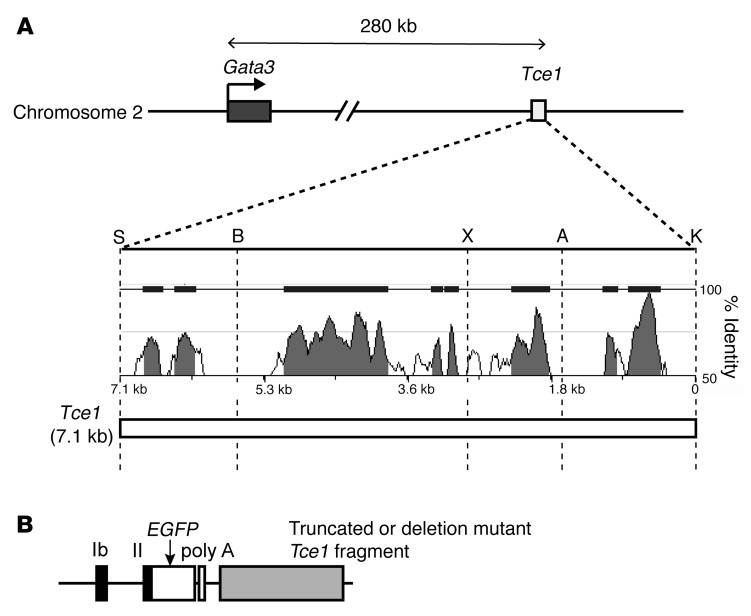
Figure 2. Truncation and deletion mutants of Tce1.
(A) Diagrams of the mouse Gata3 locus and Tce1. Sequence homology between mouse and human Tce1 sequences is depicted as a Manhattan diagram. Restriction enzyme recognition sites Sal I (S), BstII (B), XhoI (X), ApaLI (A), and KpnI (K) are shown. The genome position of Tce1 is mm9 chr2, position 9,515,156 to 9,522,270. (B) The structure of the EGFP reporter plasmid used in this study is depicted.

