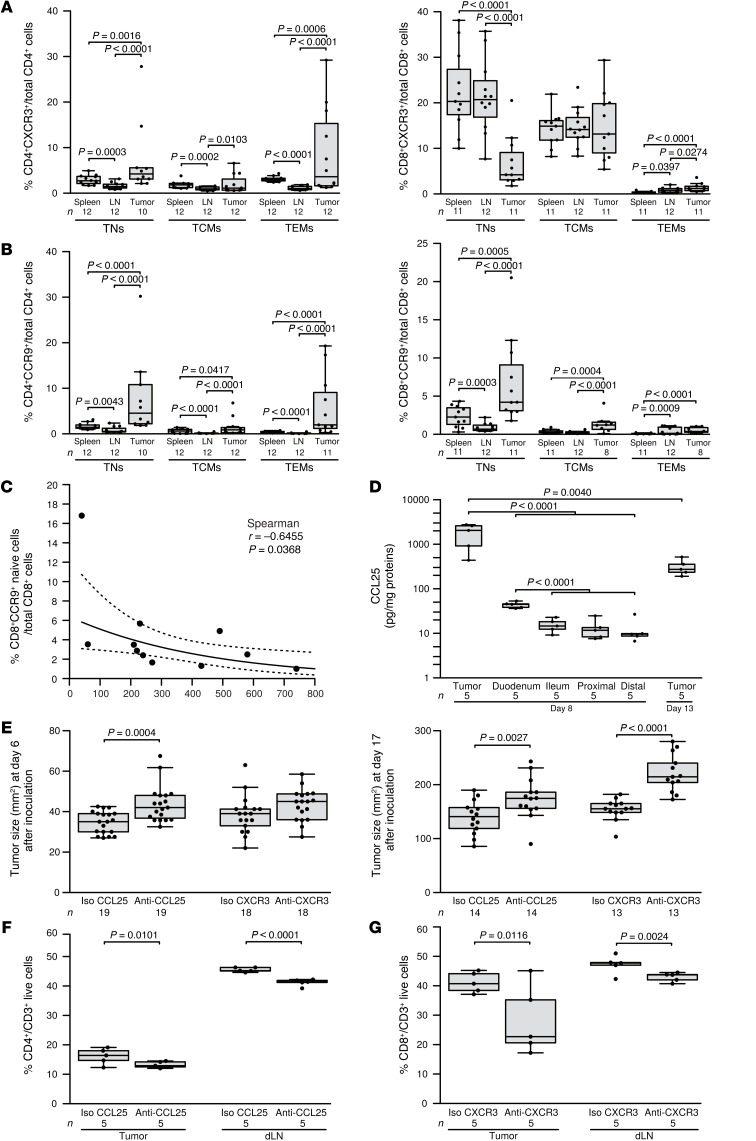
Figure 7. Neutralizing CCL25 or CXCR3 independently impacted tumor progression.
(A and B) Naive and memory CD4+ and CD8+ T cells from RET-induced mouse melanomas, metastatic LNs, and spleens analyzed by multicolor flow cytometry. TNs were characterized as CD4+CD45RB+ and CD8+CD44lo, central memory (CM), CD4+CD45RB–CD62L+, and CD8+CD44hiCD62L+ cells, while effector memory (EM) cells were defined as CD4+CD45RB–CD62L– and CD8+CD44hiCD62L– cells. Cumulative data showing expression levels of CCR9 and CXCR3 are depicted as percentages of the respective cell subset within live total CD4+ or CD8+ T cells from 3 independent experiments in the 3 locations. (C) Frequencies of CD8+CD44loCCR9+ T cells within total live CD8+ T cells in skin lesions in relation to the skin tumor weight (n = 11, 3 independent experiments). (D) Ex vivo explanted MCA205 sarcoma tumor as well as gut explants were dosed for CCL25 and normalized to total protein content. (E) MCA205 cells were inoculated in C57BL/6 mice that were concomitantly treated with i.p. administration of anti-CCL25 Ab, positive control anti-CXCR3 Ab, and their respective isotype controls (Iso) (5 injections, every 3 days). Tumor sizes were monitored until sacrifice and are depicted at day 6 (left panel) and day 17 (right panel) from 2 independent experiments. (F and G) Flow cytometric monitoring of CD4+ and CD8+ T cells in tumor beds (left panel) and tumor-dLNs (right panel) after neutralization of CCL25 or CXCR3 at the time of sacrifice (day 13). Each point represents 1 specimen, and the total number is indicated for all subpopulations studied. Statistical analyses were performed by beta regression (A and B), linear mixed-effects (D, F, and G), and linear (D and E) modeling, or by Spearman’s test. Raw P values are indicated.

